
Figure 4.
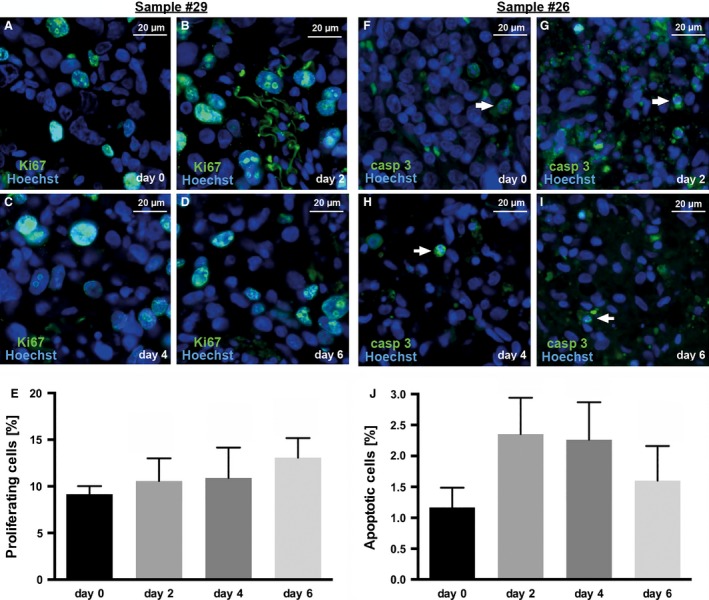
Proliferation (A–E) and apoptosis (F–J) indices in slice cultures of one human AEG (A–E) and one GC (F–J) specimen over a 6‐day culture period without cytotoxic drug exposure. (A–D) Proliferating cells were visualized using Ki‐67 staining (green) and (F–I) apoptotic cells were visualized using caspase‐3 staining (green) and were combined with nuclear counterstaining (Hoechst 33342; blue). (E) The proliferation indices did not show a decrease during the culture period proving a stable cell viability of cultured slices. (F–I) Basal apoptosis (white arrows) was observed at day 0 and every culture time point. (J) No significant increase in apoptotic cells was detected during the culture period. Fluorescent microscopy, original magnification: 400× in A–I, ±SEM, n = 3.