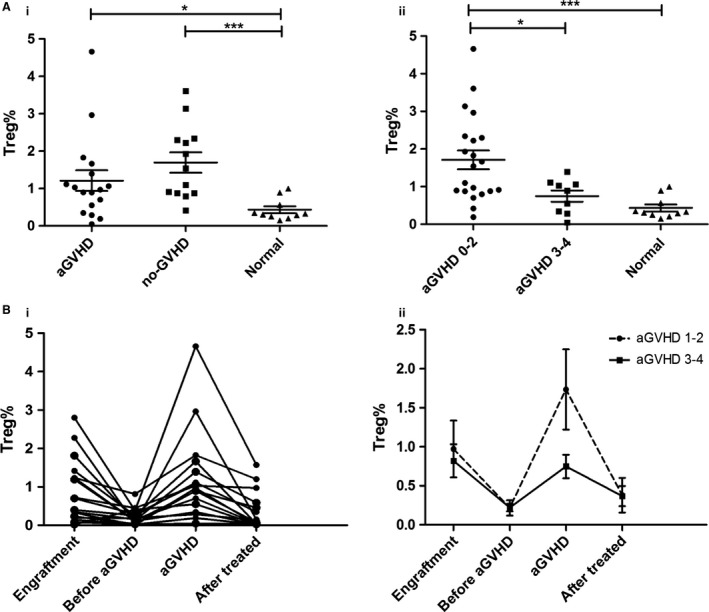
Figure 4.

Changes of cell subsets in PBMCs of patients after allo‐HSCT. (A) The frequencies of Tregs after allo‐HSCT were compared between patients and normal controls grouped by aGVHD (i) and aGVHD severity (ii). (B) The dynamic changes of Tregs frequencies after allo‐HSCT were monitored in patients with aGVHD (i) and were analyzed based on aGVHD scores (ii).
