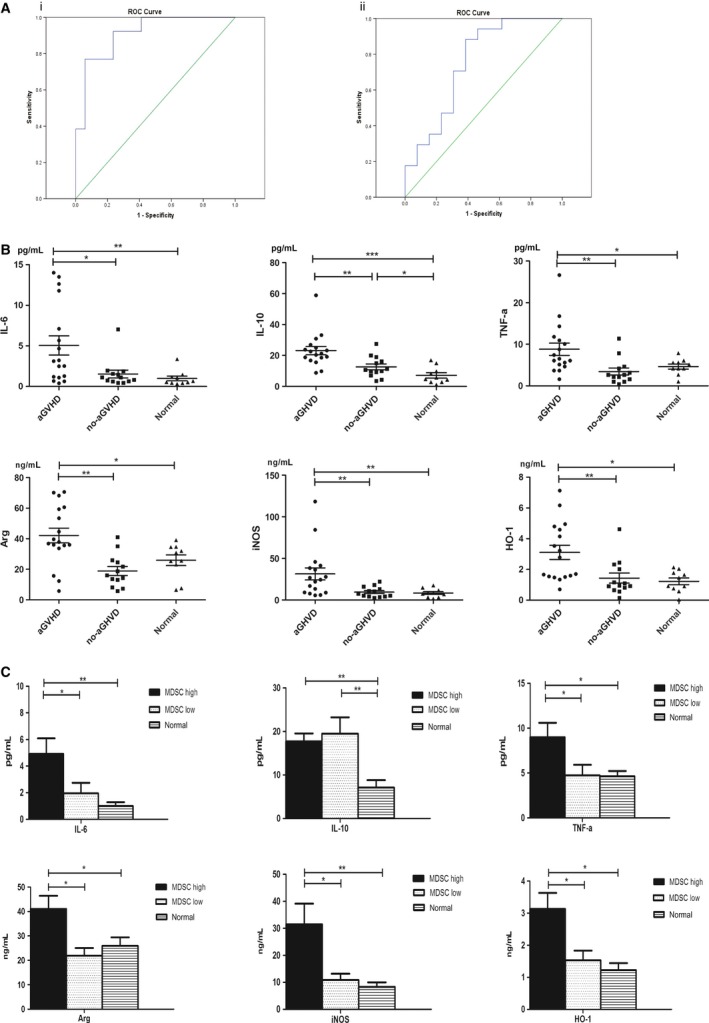
Figure 7.

Concentrations of cytokines in patients after allo‐HSCT. (A) ROC analysis of MDSCs numbers in the graft (i) and ROC analysis of MDSCs proportions in PBMCs after allo‐HSCT (ii). (B) Concentrations of cytokines in patients after allo‐HSCT. (C) Concentration of cytokines in patients grouped by MDSCs levels after allo‐HSCT.
