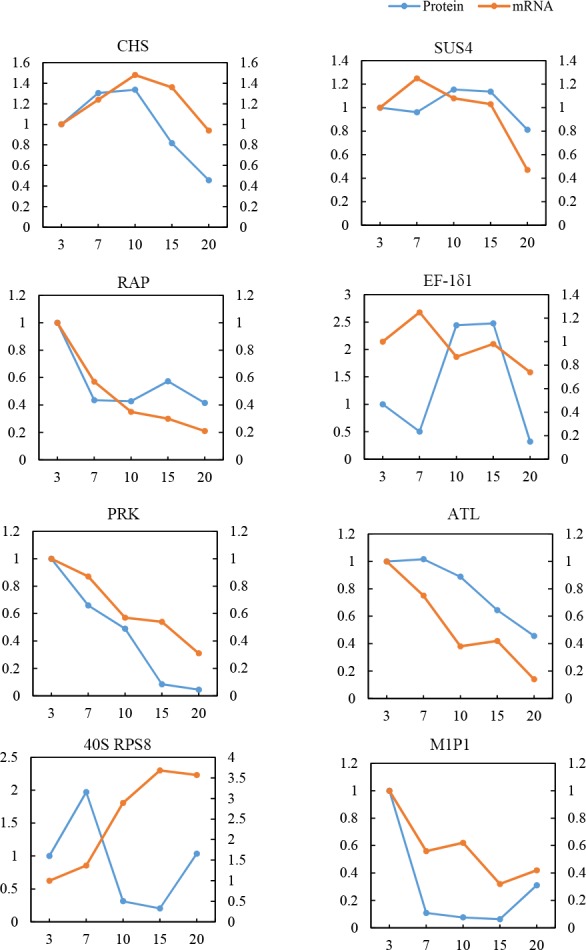
Fig 7. Comparative analysis of protein and mRNA profiles of 8 representative metabolic proteins.

The x-axis represents days after flowering (DAF). The left y-axis indicates the relative protein level, whereas the right y-axis pertains to the relative mRNA level. The blue line represents the pattern of protein expression, and the orange line indicates the pattern of mRNA expression.
