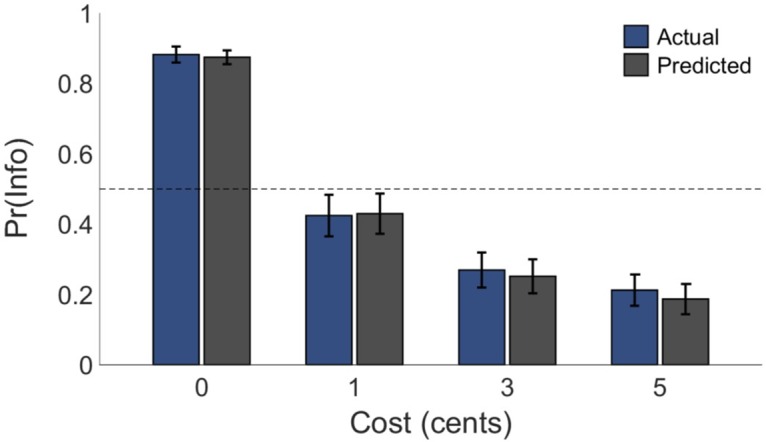
Fig 3. Model fit.

Actual (blue) and UP-predicted (grey) group-level mean proportions of information-seeking choices as a function of information cost across participants. Error bars represent SEM. N = 40.

Actual (blue) and UP-predicted (grey) group-level mean proportions of information-seeking choices as a function of information cost across participants. Error bars represent SEM. N = 40.