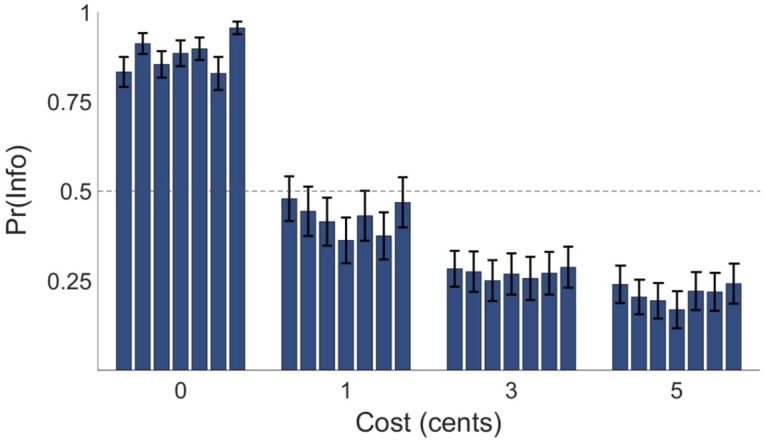
Fig 5. Block-wise behavioural results for Experiment 1.

Mean proportion of information-seeking choices, denoted Pr(Info), as a function of information cost and block number across participants. Choice proportions for blocks one to seven are presented in ascending order left to right within each of the four cost conditions. Error bars represent SEM. Preference for information was static across the task.
