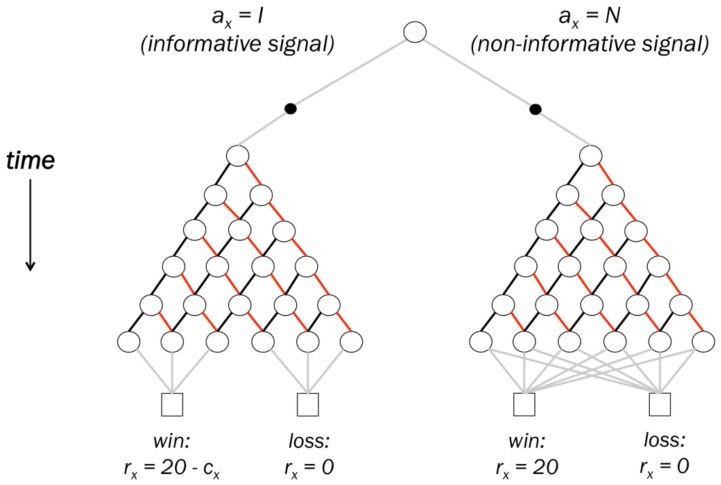
Fig 7. Trial structure represented as a Markov Decision Process.
Open circles represent states, filled circles represent actions, and squares represent terminal (trial-end) states. Lines connecting states represent state transitions; implicit in the above representation is that where no lines connect two states, the transition probability between these states is zero. Participants begin each trial in the topmost state, and can make one of two actions: to observe the informative signal (left filled circle), or to observe the non-informative signal (right filled circle). Following this choice, participants move stochastically through one of two state trees, representing the two signal types. Within each tree, transition probabilities are defined by the relative probabilities of drawing black and red cards (transitions represented respectively by black and red lines). State transitions which do not involve drawing a card are indicated in grey. The structure of the two signal trees is identical, with the exception that in the informative signal tree, each of the six states which can result after all cards are drawn (bottom row of circles) transitions to one of the two possible lottery outcomes (win/loss) with probability 1. In the non-informative signal tree, states after all cards are drawn may transition to either of the two possible outcomes.

