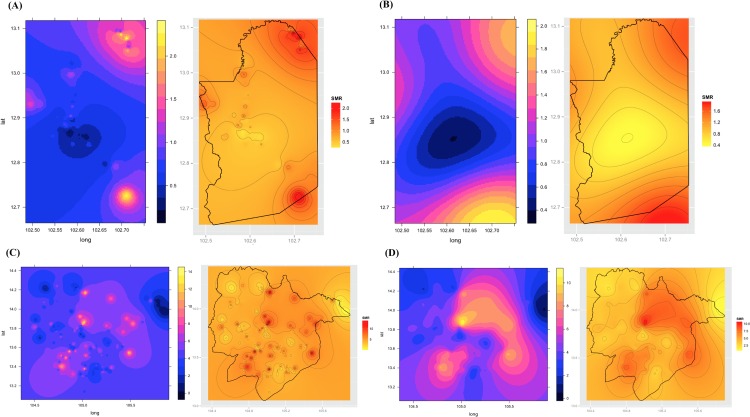
Fig 4.
Representative maps created using the proposed model for Pailin (A, B) and Preah Vihear (C, D) provinces in 2010. Maps (A) and (C) are the risk maps created by the inverse distance weighed interpolation method (IDW). Maps (B) and (D) are the risk maps created by the ordinary kriging interpolation method. Maps on the right side of each figure are the risk map created by overlaying the political boundary of target area and the contour of estimated risk.

