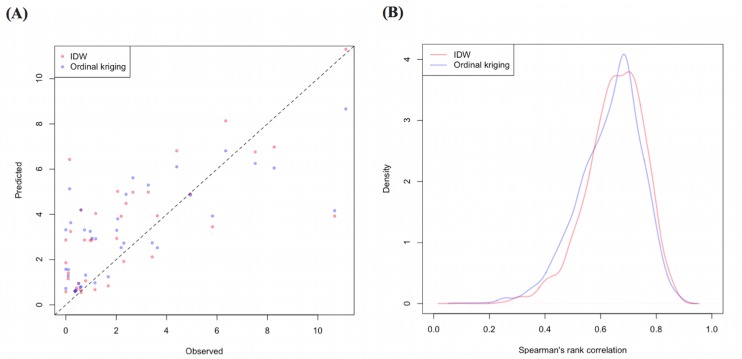
Fig 5.
Comparison of the standardized morbidity ratio calculated from geocoded case data with corresponding predicted values (A) and the kernel density plot of the resampled spearman’s rank correlation (B) in the risk map created by the model. The dashed line in (A) represents 1:1 relationship of observed and predicted values. IDW, Inverse distance weighed method.

