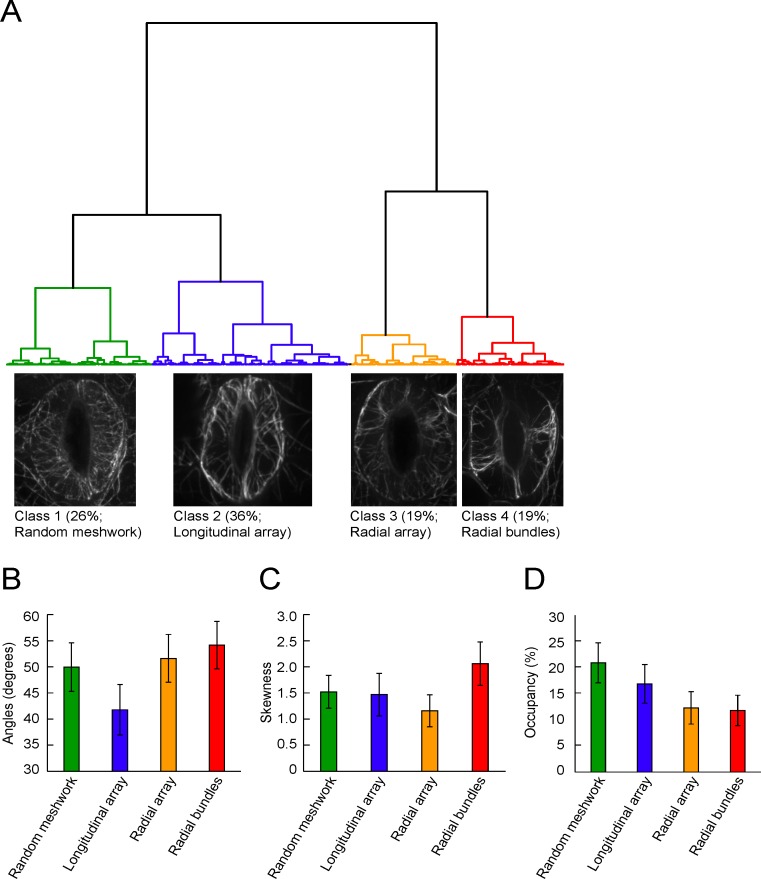
Fig 2. Quantitative evaluation, hierarchical cluster analysis and classification of cytoskeletal configurations in guard cells.
(A) Cluster dendrogram of 1793 guard cell pairs for MF configuration assignment. Data were analyzed for a total of 1793 pairs of guard cells that were image-acquired across treatment and time, including Pseudomonas syringae pv. tomato DC3000 inoculation, flg22 elicitor treatment, chitin elicitor treatment, and mock inoculations for pathogen and elicitor treatments. Also included was a temporal analysis (every 2 hours) during a 24 h diurnal cycle. Collected images were classified into four classes based on the patterns of the metrics of MF orientation, MF bundling and MF density: class 1 (random mesh works), class 2 (longitudinal array), class 3 (radial array) and class 4 (radial bundles). Representative images of class 1, 2, 3, and 4 filament orientations are shown. Characterization of each class obtained by cluster analysis of 1793 MF configurations in (B) mean angular differences between MFs and the nearest stomatal pore edge (metrics for MF orientation), (C) skewness of GFP-fABD2 fluorescence intensity distribution (metrics for MF bundling), and (D) occupancy of skeletonized MF pixels in guard cell regions (i.e., metrics for MF density).

