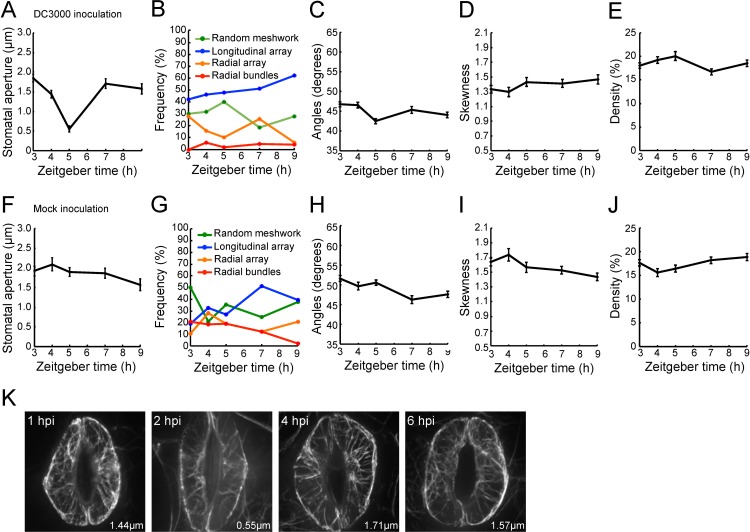
Fig 4. Evaluation of microfilament configurations and stomatal apertures following plant inoculation with a virulent bacterial pathogen.
(A) Changes in stomatal aperture following Pseudomonas syringae pv. tomato DC3000 (Pst DC3000) inoculation. (B) Changes in population distributions of each class of actin MF configuration following Pst DC3000 inoculation as obtained by cluster analysis. Changes elicited in the guard cell actin MF array by Pst DC3000 in metrics for (C) orientation, (D) bundling, and (E) density of MFs. (F) Changes in stomatal aperture following mock inoculation, and (G) the concomitant changes in population distributions of each class of MF configuration obtained by cluster following mock inoculations. Changes induced by mock inoculation in (H) orientation, (I) bundling, and (J) density. Error bars represent mean ± SEM, for stomatal apertures and indicators for MF orientation, MF bundling, and MF density. Data was collected from 3 independent biological repeats (n = 43–50). (K) Representative images of stomatal guard cells from Col-0 plants expressing GFP-fABD2 following Pst DC3000 inoculation. Micrographs shown are representative images collected at 1 h, 2 h, 4 h, and 6 h post-inoculation. The averaged values of apertures at each time point are shown.

