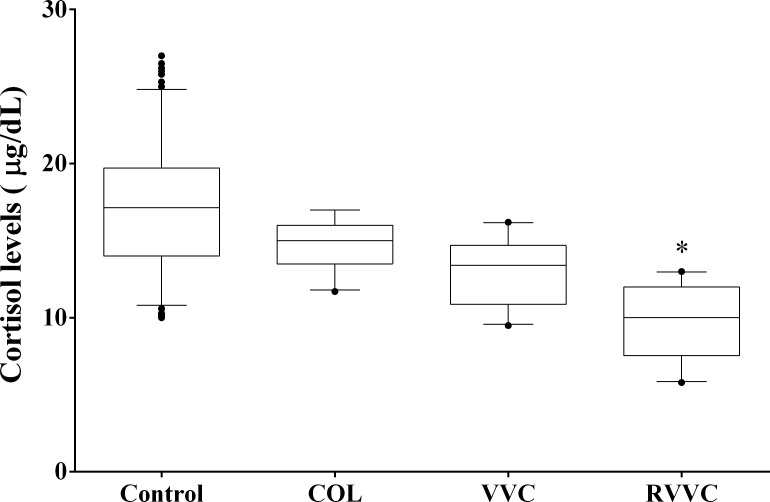
Fig 3. Morning cortisol levels according to the women clinical profiles.
Median values of each group (Control, COL, VVC and RVVC) were calculated and compared using a Kruskal-Wallis and subsequently Dunn’s post-hoc test with all pairwise comparisons identified which groups differed. Box plots show the median, 25th and 75th percentiles of the cortisol levels. Whiskers extend to the 5th and 95th percentiles; filled circles represent outliers. Cortisol levels were determined in triplicate employing chemiluminescent microparticle immunoassay in the Architect-i1000SR Immunoassay Analyzer (Abbott, Illinois, USA). *p = 0.001, shows that women of the RVVC group has a lower mean cortisol level than the control and COL groups.

