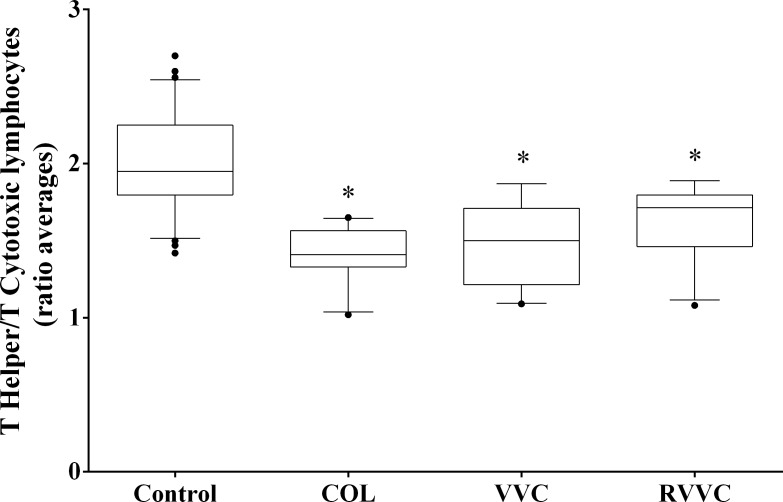
Fig 5. T helper/T cytotoxic lymphocytes ratio according to the clinical profiles.
Median values of each group (Control, COL, VVC and RVVC) were calculated and compared using a Kruskal-Wallis and subsequently Dunn’s post-hoc test with all pairwise comparisons identified which groups differed. Box plots show the median, 25th and 75th percentiles of the overall median level of antioxidant capacity. Whiskers extend to the 5th and 95th percentiles; filled circles represent outliers. T helper/T cytotoxic lymphocytes ratio was determined in triplicate performed on a BD-FACS Calibur flow cytometer equipped with an argon laser and BD Multiset software for data analysis (Becton Dickinson TriTEST immunofluorescence, Becton Dickinson, San José, California, USA). *p<0.0001, the COL, VVC and RVVC group had lower T helper/T cytotoxic lymphocyte ratios than the control group.

