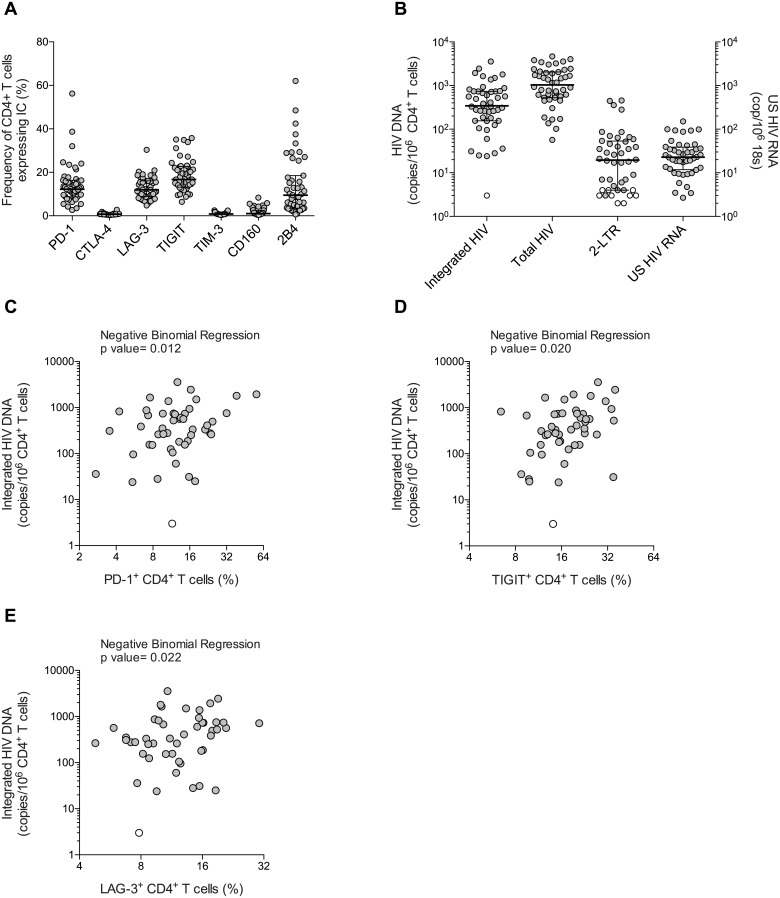
Fig 1. PD-1, TIGIT and LAG-3 are associated with virological markers of HIV persistence during ART.
(A) Expression of 7 ICs on CD4+ T cells in individuals receiving suppressive ART (n = 48). Data is represented as percentage of CD4+ T cells and horizontal bars indicate median values with interquartile ranges. (B) Size of the HIV reservoir measured by integrated HIV DNA, total HIV DNA, 2-LTR circles represented as copies per million CD4+ T cells and cell-associated US HIV RNA represented as copies per million copies of 18S. Horizontal bars indicate median values with interquartile ranges and open circles represent the limit of detection in the negative samples (based on cell input). (C), (D), (E) Associations between the frequency of CD4+ T cells harboring integrated HIV DNA and the frequency of CD4+ T cells expressing PD-1, TIGIT and LAG-3, respectively. P values were obtained from negative binomial regression analysis. Effect sizes for the associations are as follows: (C) A 2-fold increase in the percentage of PD-1+ CD4+ T cell was associated with 1.43-fold increase in the frequency of CD4+ T cell harboring integrated HIV DNA, (D) a 2-fold higher percentage of TIGIT+ CD4+ T cell was associated with 1.91-fold higher integrated HIV DNA and (E) a 2-fold higher percentage of LAG-3+ CD4+ T cell was associated with 1.62-fold higher integrated HIV DNA. Open circles represent the limit of detection in the negative samples (based on cell input).

