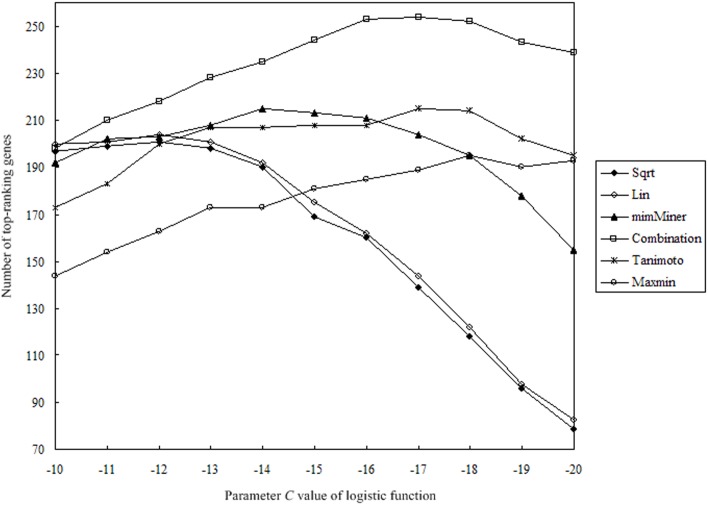
Fig 4. Correlation between parameter C of the logistic function and the number of top-ranking genes.
Correlation curve of parameter C of the logistic function and the number of top-ranking genes is plotted, and the slow peak value is presented for each of the six disease phenotype networks. The combination is an integration of mimMiner and Tanimoto in the respective proportion of 50%.

