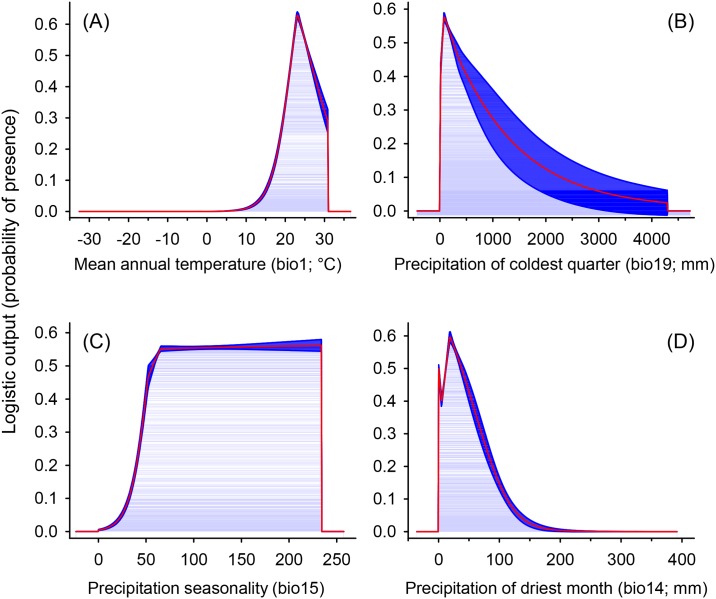
Fig 5. Response curves of the best predictors of C. fimbriata in the best model.
(A) mean annual temperature (bio1; °C), (B) precipitation of coldest quarter (bio19; mm), (C) precipitation seasonality (Coefficient of variation; bio15), and (D) precipitation of driest month (bio14; mm). Red lines are the mean response curves and blue margins are ± Standard Deviation calculated over 10 replicates.

