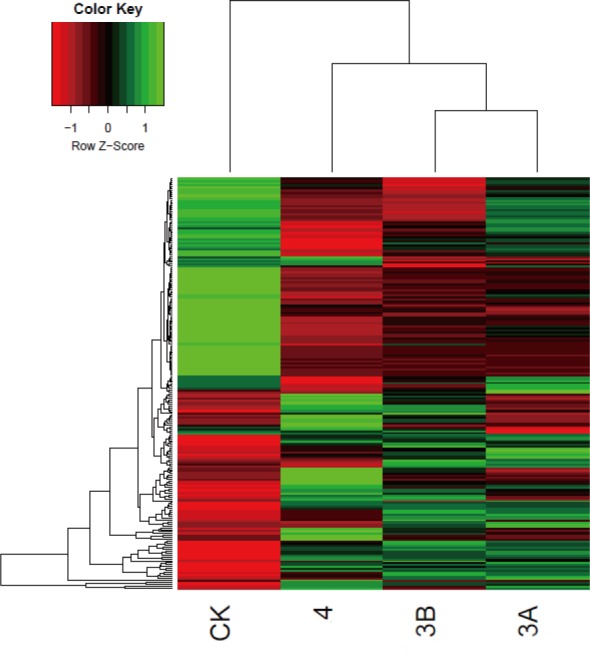
Fig 3. Heat map analysis of the differentially expressed proteins between the CK group and three groups of patients with different stages of Coats' disease.

The color scale shown at the top illustrates the relative protein expression level across all the samples. Red represents an expression level lower than the mean, whereas green represents an expression level above the mean.
