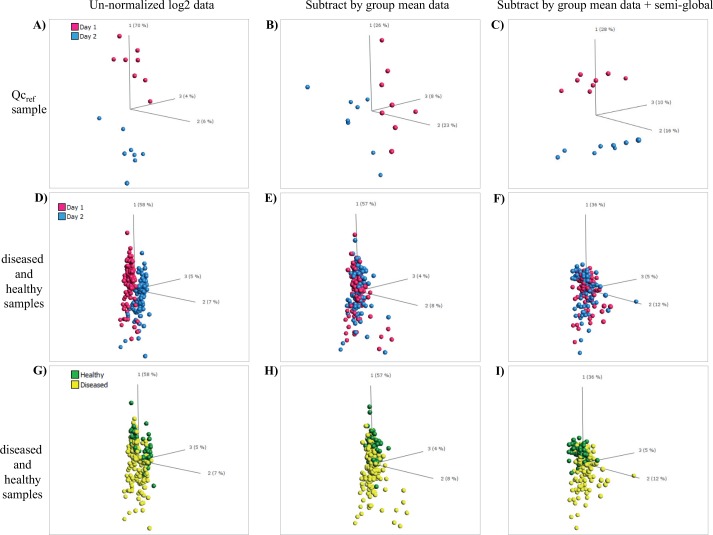
Fig 8. Effect of the normalization on sample variability.
Un-normalized log2 data was compared with subtract by group mean normalized data as well as with subtract by group mean + Semi-global normalized data. The sample cohort included QCref samples as well as diseased and healthy samples. (A to C) QCref samples analyzed on two days. (D to F) Diseased and healthy samples analyzed on different days (mapped for day 1 vs. day 2). (G to I) Diseased vs. healthy samples analyzed on different days (mapped for diseased/healthy).

