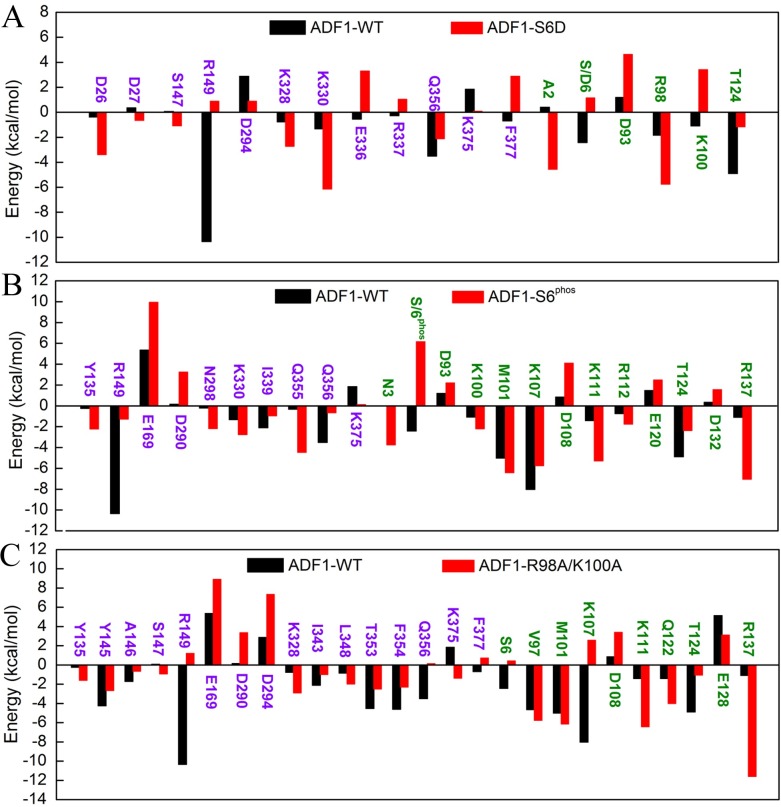
Fig 4. Per-residue energy contribution plots.
The residues displayed as purple belong to actin1 and the green residues belong to ADF1. (A). Comparison between wild type (WT) and ADF1-S6D systems of per-residue energy contributions; (B). Comparison between wild type (WT) and ADF1-S6phos systems of per-residue energy contributions; (C). Comparison between WT and ADF1-R98A/K100A systems of per-residue energy contributions.

