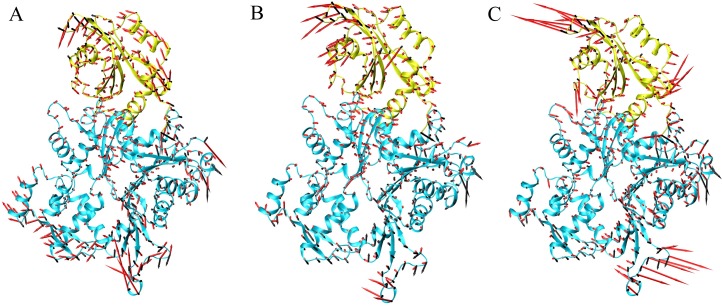
Fig 7. Porcupine plots of the eigenvectors.
Actin and actin-depolymerizing factor 1 (ADF1) shown in cyan and yellow, respectively. The arrows attached to each backbone atom indicate the direction of the eigenvector and the size of each arrow shows the magnitude of the corresponding eigenvalue. (A). Comparison of wild type (WT) (black arrow) and ADF1-S6D (red arrow) systems; (B). Comparison of wild type (WT) (black arrow) and ADF1-S6phos (red arrow) systems; (C). Comparison of WT (black arrow) and ADF1-R98A/K100A (red arrow) systems.

