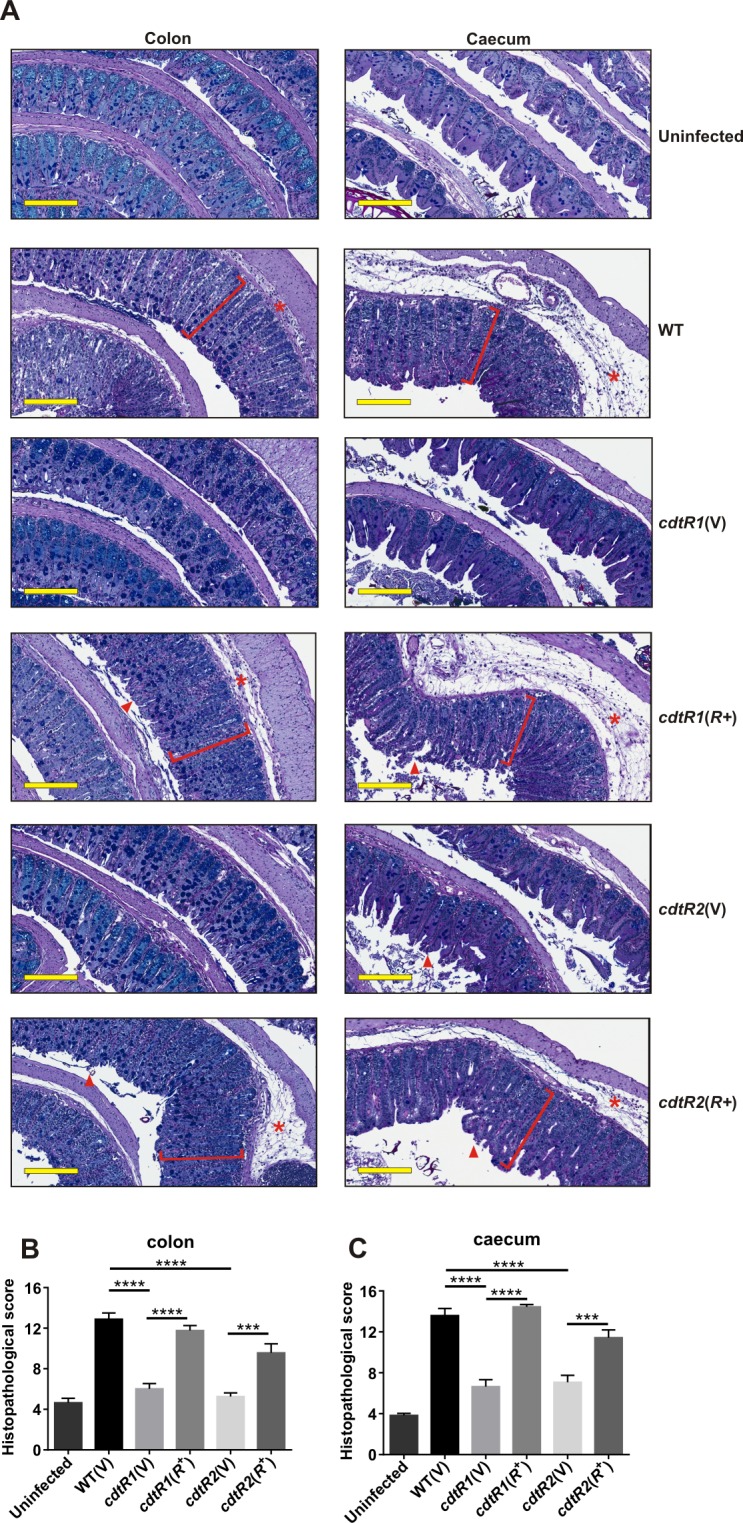
Fig 6. Histopathology of C. difficile infected tissues.

Representative images of sections of colon and caeca collected from uninfected mice or mice infected with different strains of C. difficile, fixed and strained with PAS-Alcian blue. Red brackets ([) indicate crypt hyperplasia, arrow heads (▲) represent surface epithelial damage and asterisks (*) represent oedema and inflammation. Scale bars (200 μm) are shown in yellow. Histopathology damage scores from uninfected or infected colons (b) and caeca (c). Data represent the mean ± SEM ****, p ≤ 0.0001.
