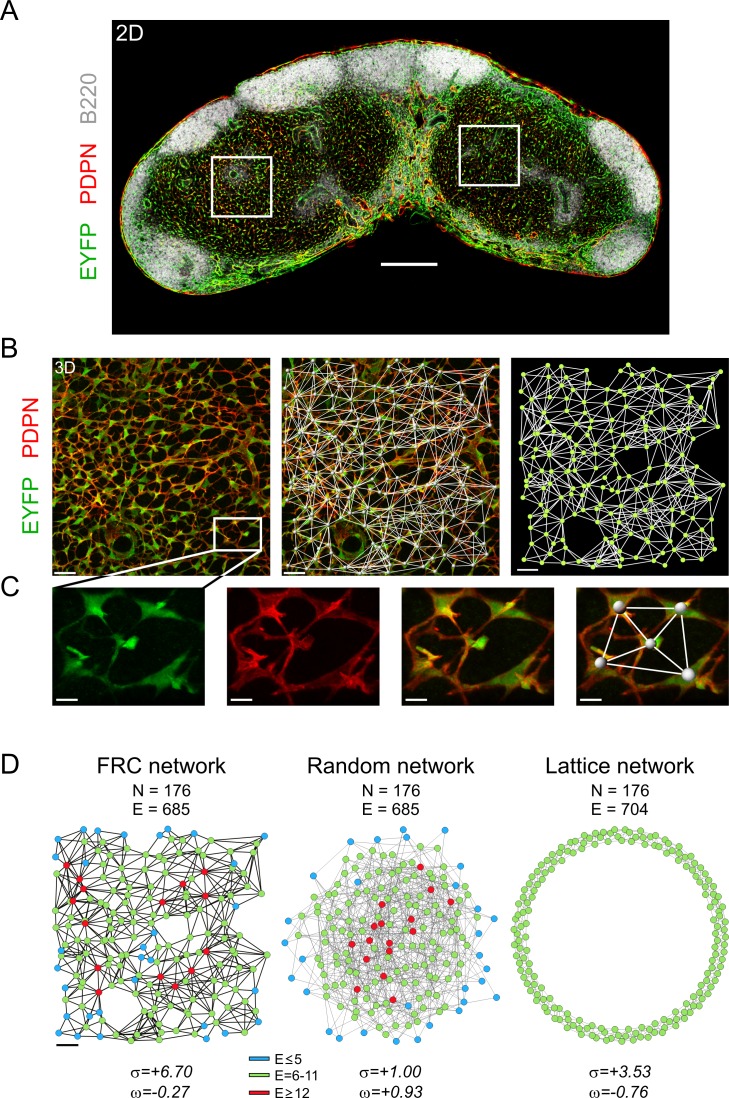
Fig 1. Assessing the topology of the T cell zone FRC network.
(A) Overview 2-D image of an inguinal LN section from a naive adult Ccl19eyfp mouse stained with antibodies against the indicated markers. Rectangles indicate representative T cell zones acquired with high-resolution confocal microscopy. (B) Representative 3-D Z-stack indicating the T cell zone FRCs (left panel), merged with FRC network (middle panel) and the network representation (right panel) with nodes (FRCs) and edges (physical connections). Size of T cell zone image: 304 x 304 x 32 μm. (C) Zoom-in area of single FRCs from (B, left panel) with signals for EYFP, PDPN, merged, and network representation, respectively. (D) Representative FRC network from (B, right panel). The equivalent random network was constructed using the Erdos-Renyi model, and the regular ring lattice network was constructed with eight edges for every node (FRC network median). Lattice and random networks are shown in Kamada-Kawai representation, while the FRC network is arranged in the real coordinate system of the LN T cell zone. N denotes the number of nodes, and E denotes the number of edges for each network. Small-world parameters σ and ω are shown below. The color legend represents number of edges per node. Data are representative of six mice from two independent experiments. Scale bars represent 300 μm (A), 30 μm (B, D), and 10 μm (C).

