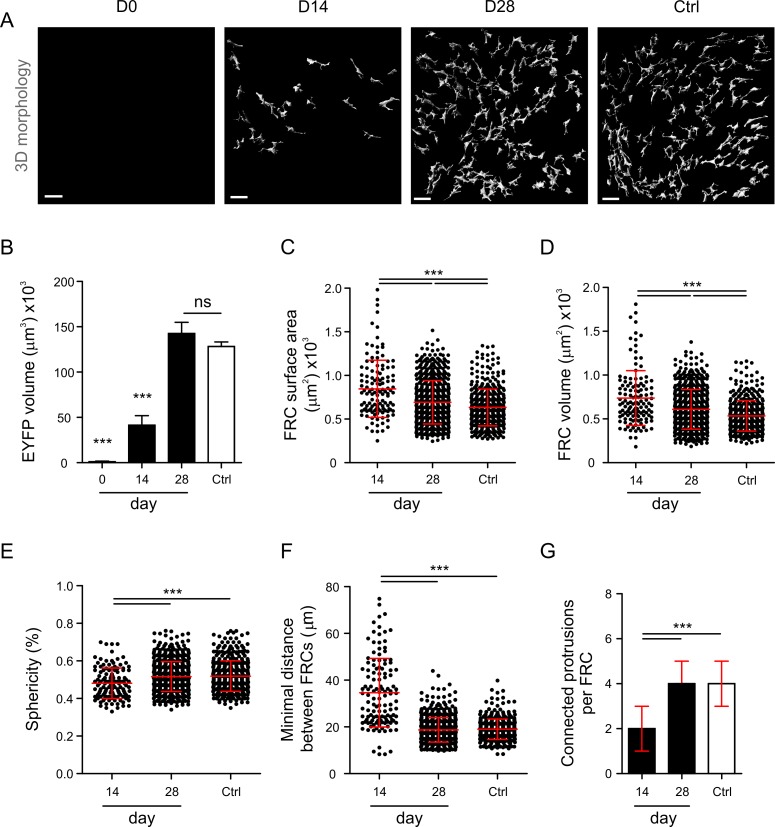
Fig 2. Changes in FRC morphology following diphtheria toxin (DT)-mediated ablation.
(A) Three-dimensional single-cell reconstruction of the T cell zone FRC network in Ccl19eyfp/idtr mice at indicated time points after two intraperitoneal (IP) injections of 8 ng/g DT or phosphate-buffered saline (PBS)-treated controls. Scale bars represent 30 µm. (B) Global morphological analysis of the total FRC network volume from the 3-D-reconstructed EYFP channel. (C–G) Single-cell analysis of FRC surface area (C), volume (D), sphericity (E), minimal distance between FRCs (F), and connected protrusions per FRC (G). Each dot represents a measurement for a single FRC. Data represent mean ± standard deviation (SD) (B–F) and median ± interquartile range (IQR) (G) for 3–5 mice per group. * p < 0.05, ** p < 0.01, *** p < 0.001 (one-way ANOVA with Tukey’s post-test [B–F] or Kruskal-Wallis test with Dunn’s post-test [G]). ns, not significant.

