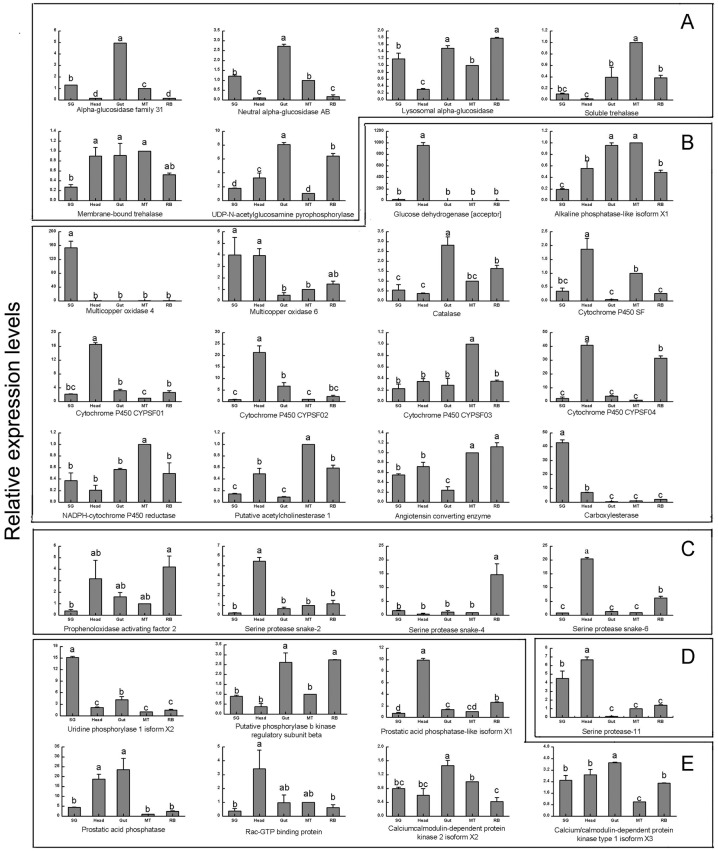
Fig 3. Transcript abundances of WBPH salivary protease genes in different tissues as measured by RT-qPCR.
SG: salivary gland; Head: head without salivary gland; Gut: gut; MT: malpighian tubule; RB: remaining body (without salivary gland, head, gut and malpighian tubule). (A) Sugar metabolism; (B) Detoxification and inhibition of plant defenses; (C) Immune related; (D) General digestion; (E) Other proteins.

