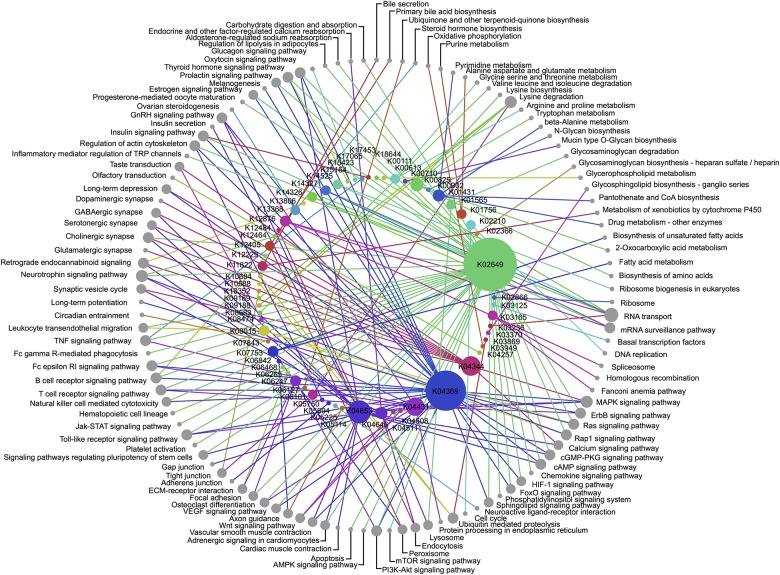
Fig 2. Network analysis of the KEGG Orthologs and the pathways with which they are associated in the KEGG database.
Each node in the inner circle represents a KEGG Ortholog and each node in the outer circle indicates the pathway in which each KO is involved. The size of each node is proportional to its connectivity.

