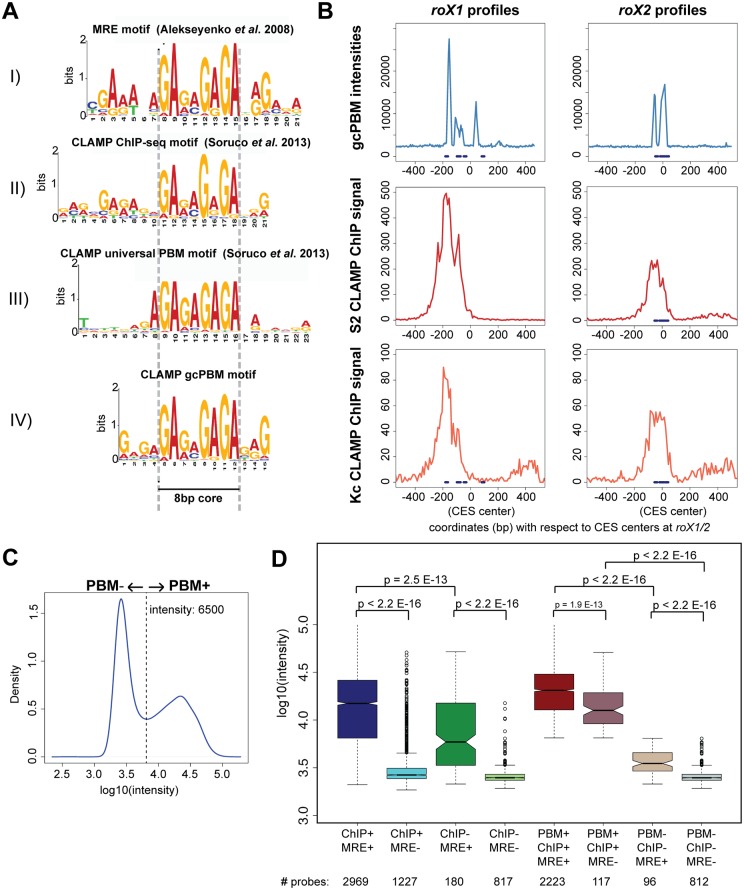
Fig 1. CLAMP directly binds to a long GA-rich motif that is enriched at in vivo targets.
A) The following motifs are shown: I) MRE motif [13]. II) CLAMP in vivo motif derived from ChIP-seq data from S2 cells [20]; III) CLAMP in vitro motif derived from the uPBM [20] and IV) CLAMP in vitro motif that we derived from the custom gcPBM. The most conserved part of the motifs, their 8-bp core, is highlighted between two dashed lines. B) gcPBM intensities (intensity from genomic context PBM) (top) and CLAMP ChIP signal (input normalized RPKM: Reads per Kb per Million) for S2 (middle) and Kc (bottom) cells are plotted for 800 bp windows centered at each of two MSL complex CES (roX1, left, and roX2, right). MRE sequences are shown as blue dashes on each profile. C) A histogram of intensities from the gcPBM experiment. The intensity of 6500, between the two peaks of the bimodal distribution, is indicated with a dashed line. Probes with intensities higher than 6500 are designated PBM+ and those that are lower than 6500 are considered PBM-. D) Box plots are used to compare the intensities for probes sorted by whether they contain sequences that are bound or unbound from in vivo ChIP-seq data (ChIP +/-) and whether or not they conform to the previously characterized MRE motif (MRE+/-). In the right half of the panel, probes were resorted to add the category of bound or unbound on the PBM (PBM+/-). p-values for comparisons between categories are displayed above the relevant boxes, and the number of probes for each category are listed for each group. For each box plot used throughout this study, the collared box indicates that 95% percent confidence interval. If the notches at the center of the box are not overlapping, it indicates that two samples are statistically different from each other.

