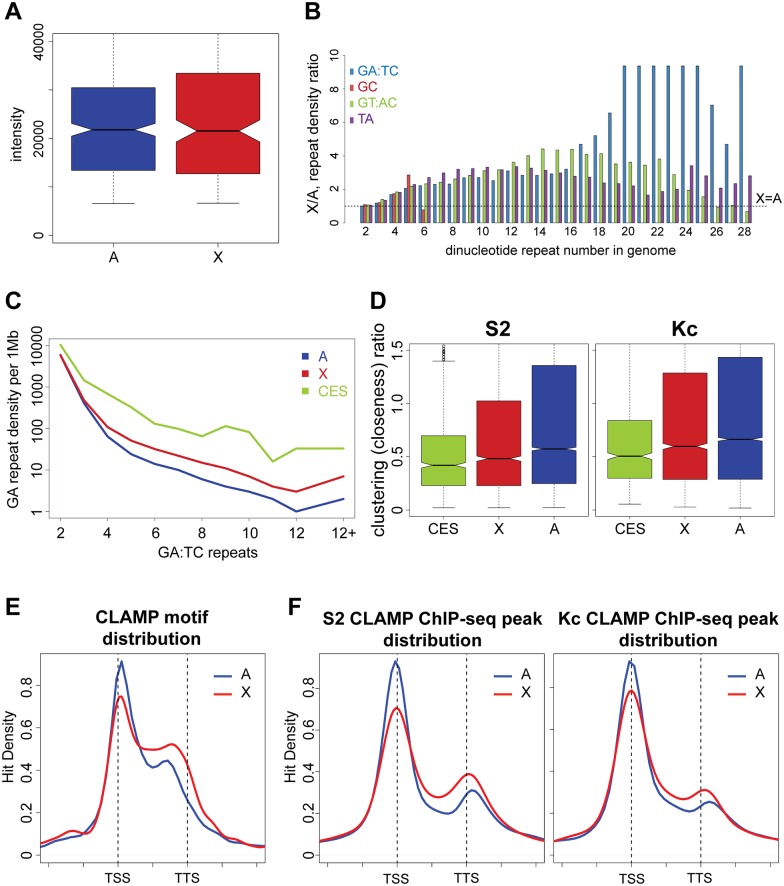
Fig 4. The X-chromosome has more GA-repeats than autosomes and the CES have clustering of CLAMP occupancy.
A) Distribution of the PBM intensities of the probes aligned to the X-chromosome (red) versus autosomes (blue). B) The density of different dinucleotide repeats on X-chromosome is compared with autosomes for different repeat lengths within the D. melanogaster genome. Any value above 1 indicates a higher repeat density on X-chromosome compared with autosomes. C) Density of GA repeats (1 = GA, 2 = GAGA, etc.) per 1 Mb along Autosomes (A, blue), the X-chromosome (X, red), and X-chromosome CES (CES, green). D) Top: Average distance between n neighboring CLAMP ChIP-seq peaks in S2 (left) and Kc (right) cells. Peaks are separated as within CES (green), on X (red), or on autosomes (blue). Bottom: The average distances are replotted for S2 (left) and Kc (right) cells after normalization using distances measured between n random peaks. E) A histogram showing the frequency of each 15-bp CLAMP motif at a particular location relative to genes on the X (red) or autosomes (blue). The profiles are shown around gene bodies and the range is from one gene length before the TSS to one gene length after the TTS. The distance from the TSS is normalized to gene length for each gene. F) Average gene profiles of CLAMP ChIP-seq peaks on X (red) and autosomes (blue) from S2 cells (male) and Kc cells (female). Normalization was conducted as for E.

