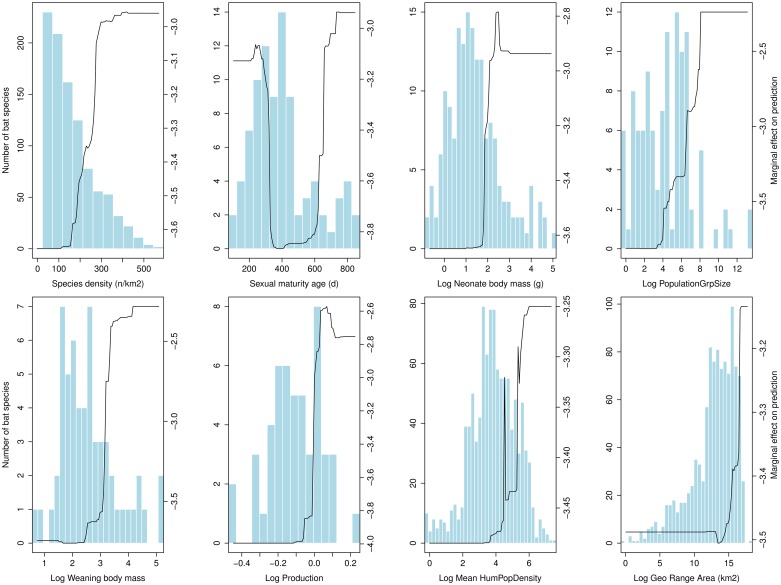
Fig 1. The trait profile of filovirus-positive bat species.
Partial dependence plots of the top 8 predictor variables from a generalized boosted regression analysis illustrate the trait profile of bat species that are positive for filoviruses in the wild. Plots appear in order of predictive importance from left to right, top to bottom. Line graphs depict the marginal effect of a given variable for correctly predicting filovirus-positive status in bats. Blue frequency histograms show the distribution of available trait values across all 1116 bat species while the solid curve shows the trait tendencies for filovirus-positive bat species.

