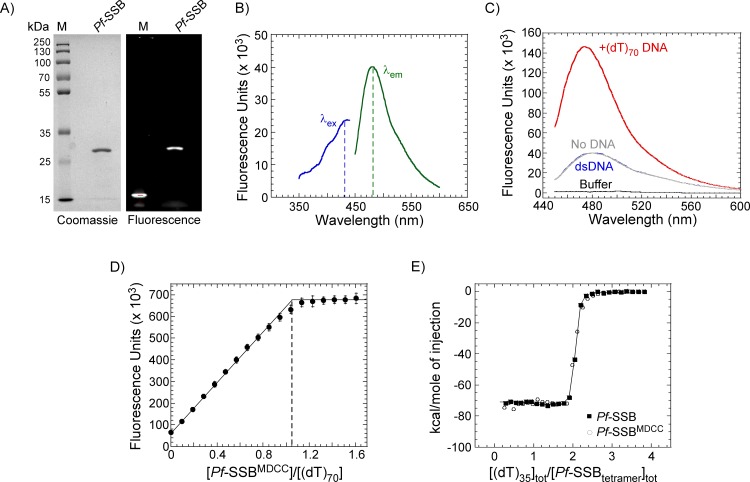
Fig 2. DNA binding properties of Pf-SSBMDCC.
(A) Purified Pf-SSBMDCC was analyzed on a 12% SDS-PAGE gel and imaged after staining with coommassie dye or detected using fluorescence imaging. M denotes the protein ladder. (B) Excitation (blue, λex) and emission (green, λem) spectra of 1 μM Pf-SSBMDCC are shown. The dotted lines correspond to an excitation and emission maxima of 430 nm and 482 nm, respectively. (C) 1 μM Pf-SSBMDCC was excited at 430 nm and emission spectra were measured in the absence of DNA (grey) and in the presence of a 125 bp dsDNA (blue) or an oligo-dT 70 nt ssDNA (red). A four-fold increase in Pf-SSBMDCC fluorescence is observed in the presence of the (dT)70 ssDNA oligonucleotide. (D) Fluorescence titration of Pf-SSBMDCC with increasing concentrations of ssDNA [(dT)70]. Pf-SSBMDCC binds stoichiometrically, with one SSB tetramer binding to one (dT)70 oligonucleotide as denoted by the dotted line. The mean values and standard errors from three independent experiments are shown. (E) Isothermal calorimetric measurement of changes in enthalpy associated with binding of two (dT)35 molecules to Pf-SSB and Pf-SSBMDCC are shown. Both proteins bind stoichiometrically with similar observed heat changes ΔHobs = -73.1±0.2 kcal mol-1 and -71.8±0.2 kcal mol-1 for Pf-SSB and Pf-SSBMDCC, respectively. The mean values and standard errors from three independent experiments are shown.

