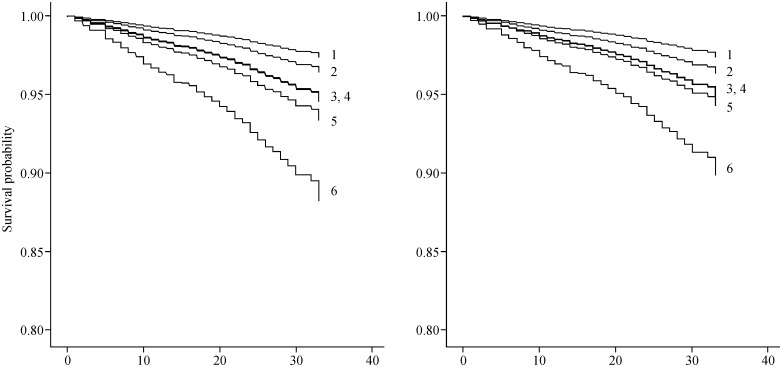
Fig 1. Estimated survival rates according to the incidence of disability and cognitive impairment status.
The left panel shows survival curves according to the incidence of disability adjusted for age and sex, and the right panel shows the fully adjusted model. 1, non-cognitive impairment group; 2, non-mild cognitive impairment with general cognitive impairment group; 3, mild cognitive impairment single domain group; 4, mild cognitive impairment single domain with general cognitive impairment group; 5, mild cognitive impairment multiple domain group; 6, mild cognitive impairment multiple domain with general cognitive impairment group.

