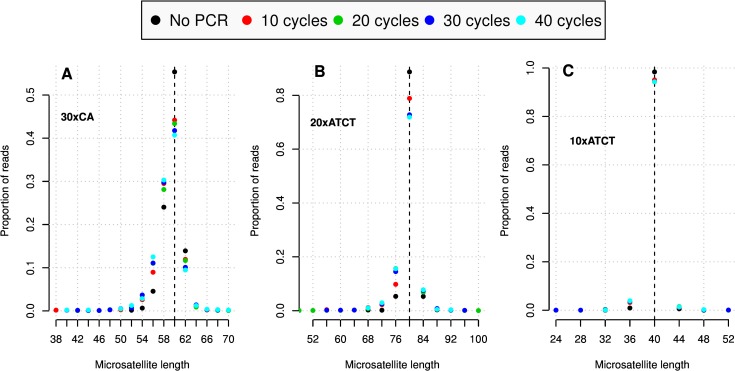
Fig 1. Mean distribution of enzyme slippage errors.
Each dot in the graphs is a proportion of reads (y-axes) corresponding to the microsatellite lengths (bp) indicated on the x-axes. The dots are color coded according to the number of PCR cycles indicated above. A. Mean of two replicates of 30xCA repeat sequence. B. Mean of two replicates of 20xATCT repeat sequence. C. Mean of four replicates of 10xATCT repeat sequence. Singleton reads and reads with lengths not corresponding to multiples of the repeat units are not shown.

