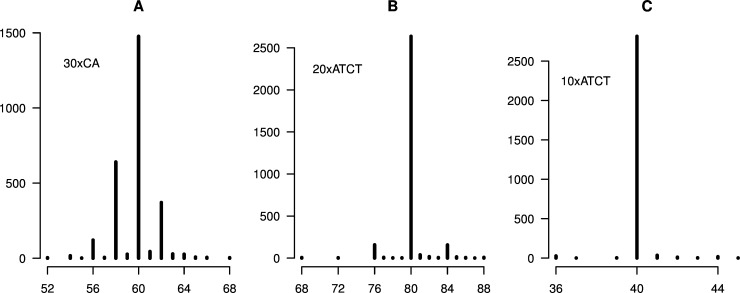
Fig 2. Microsatellite length distributions for no-PCR controls.
A. 30xCA. B. 20xATCT. C. 10xATCT (mean of scores from constructs 1 and 2). The y-axes indicate the number of SMRT sequence reads corresponding to the sequence length (bp) indicated on the x-axes. Singleton read lengths have been omitted from the plots for enhanced visualization (see S4, S9, S14 and S19 Figs for full details).

