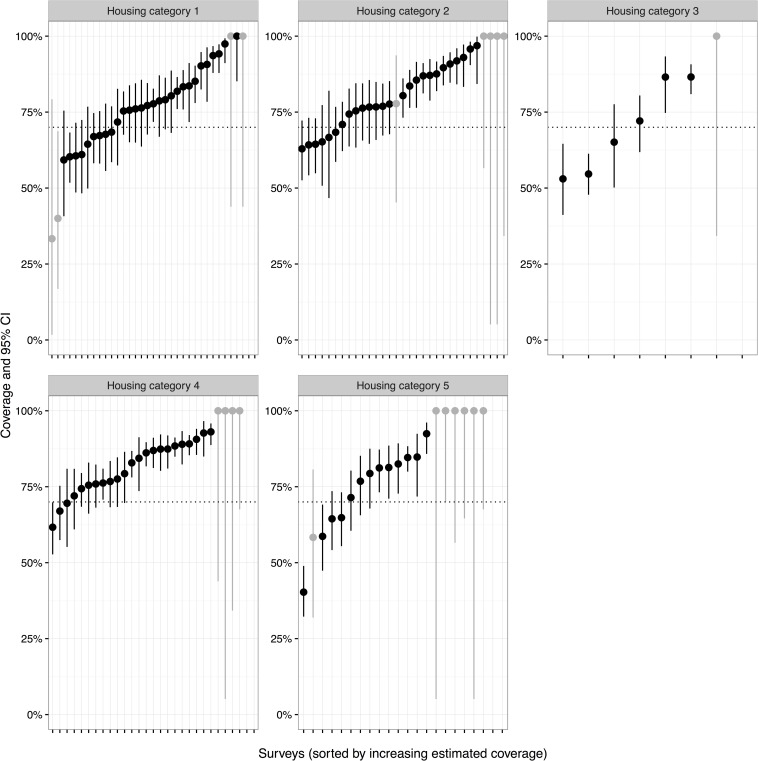
Fig 6. Graphs of estimated vaccination coverage per survey for all dogs (adults and puppies) by individual post vaccination survey and grouped according to Housing categories 1–5 with 95% confidence intervals.
Light grey lines indicated surveys which recorded less than 20 dogs within that particular land type.

