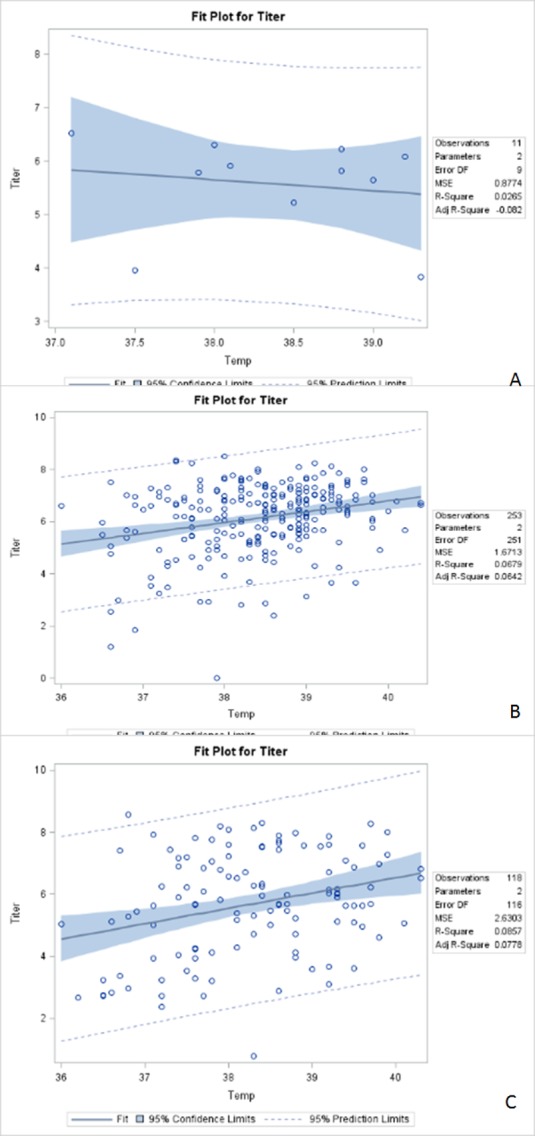
Fig 2. Scatterplots of log-transformed viremia titer by body temperature (Temp) overlaid with the fit line, a 95% confidence band and lower and upper 95% prediction limits.

2A. 0–17 years. R-Square: 0.0265; Correlation coefficients: -0.30524; p = 0.6327. 2B. 18–64 years. R-Square: 0.0679; Correlation coefficients: 0.26053; p < 0.0001. 2C. 65 years & over. R-Square: 0.0857; Correlation coefficients: 0.29269; p = 0.0013
