
Figure 5.
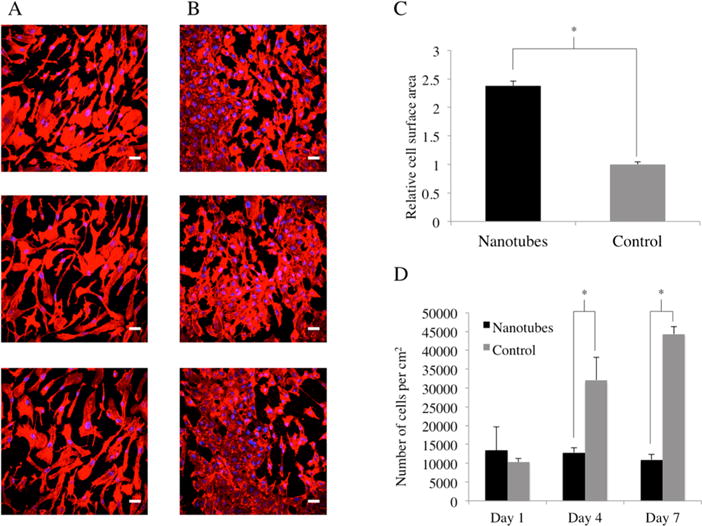
Fluorescence microscopy images of HAEC on nanotubular coated Nitinol (A) and flat control Nitinol (B) after 7 days of culture. FITC-Phalloidin staining of F-actin is shown in red, whereas DAPI staining of cell nuclei is shown in blue. Scale bars are 50 μm. Cell spreading is represented by the average cell surface area (C) normalized to that of the control, while HAEC growth (D) is represented in number of cells per cm2 over a period of 7 days. * = p < 0.01, N = 5.