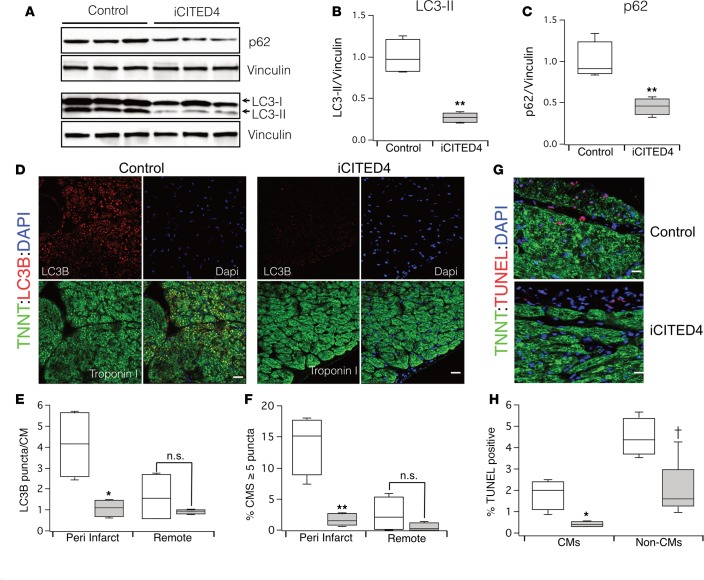
Figure 4. Modulation of autophagy with CITED4 expression 1 week after IRI.
(A) Western blot demonstrating accumulation of LC3-II and p62 in control samples as compared with iCITED4 transgenics. (B) Quantification of LC3-II (relative reduction of 71% ± 3.1% in iCITED4 mice) and (C) quantification of p62 (Relative reduction of 54% ± 8% in iCITED4 transgenics). (D) Representative micrographs of cardiac sections demonstrating accumulation of LC3B dots in cardiomyocytes (CMs). Sections were stained with antibodies for Cardiac Troponin T (green), LC3B (red), and DAPI (blue). Scale bars: 50 μm. (E) Quantification of LC3B puncta per cardiomyocyte and (F) percentage of cardiomyocyte with greater than 5 LC3B puncta in both the peri-infarct area and remote to the area of injury. n = 5 mice per group and at least 20 high power fields (hpf) per section. (G) Micrographs of TUNEL staining demonstrate a reduction in apoptosis in iCITED4 transgenics. Sections were stained with antibodies for Cardiac Troponin T (green), TUNEL (red), and DAPI (blue). Scale bars: 50 μm. (H) Quantification of TUNEL-positive cells both CMs and noncardiomyocytes (Non-CMs). †P = 0.06 for Non-CMs by Student’s t test. For all graphs: significance determined by the Student’s t test unless otherwise specified; *P < 0.05, **P < 0.01.

