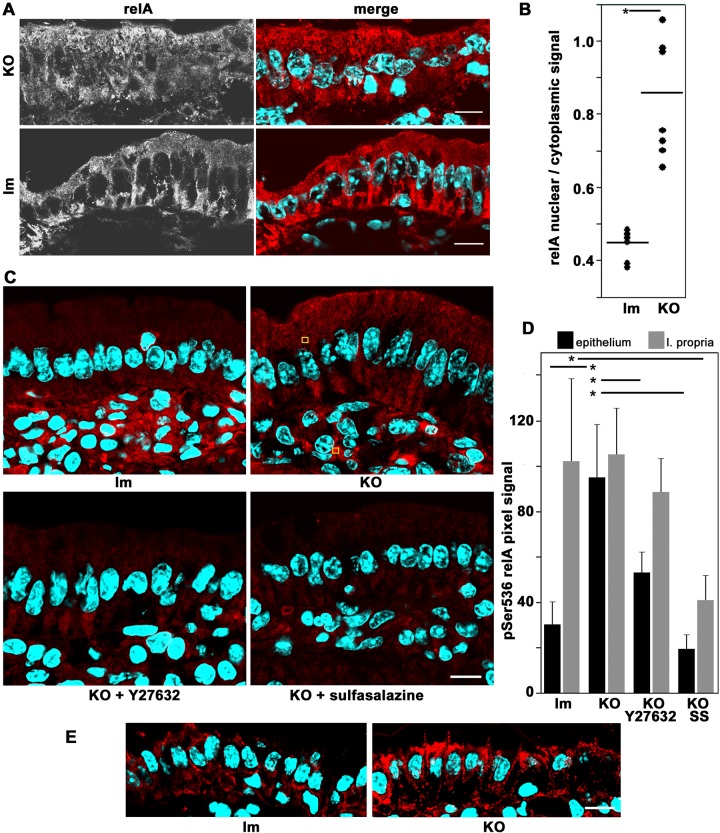
FIGURE 7:
Activation of NF-κB in of Prkciflox/flox Vil-CRE± (KO) villus enterocytes. (A) Frozen sections of villus enterocytes from untreated KO or littermate control (Prkciflox/flox Vil-CRE- or Prkciflox/− Vil-CRE+; lm) animals processed with anti-relA(p65) (red channel) and DAPI (blue channel). (B) Quantification of the data in A. Average pixel values were measured in ROIs in the cytoplasm or the nucleus. Several cells were measured in four to seven random sections. Each dot represents the average of all of the measured cells from one animal. Horizontal bars show averages of each group. *Kruskal–Wallis test, H0 = control and KO populations are equal, p < 0.003. (C) Frozen sections of intestinal villi were processed with anti-pSer536 relA (red channel) antibody. Animals were untreated controls (lm) or KO, as well as KO mice treated with ROCK inhibitor Y27628 or SS. Yellow squares show examples of randomly located ROIs in epithelia or lamina propria cells used for measurements in D. (D) Quantification of pixel values in images like those in C using ROIs in epithelial cells (black bars) or in lamina propria cells (gray bars) for control littermate (lm) or KO animals or KO animals treated with Y27628 or SS. Data shown as average and SD. *t test for difference between average in untreated KO epithelial cells (n = 22) and corresponding controls (n = 28) or between untreated KO epithelial cells and KO treated with Y27628 (n = 29) or between untreated lamina propria cells in KO compared with SS-treated cells, p < 0.001. (E) The sections were processed with anti-ROCK1/2 antibody. Bars, 10 μm.

