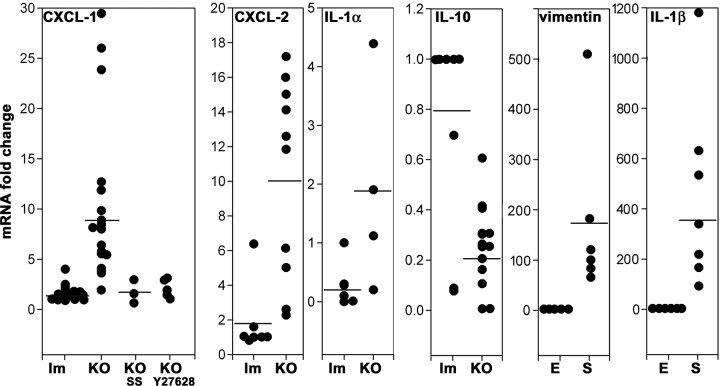
FIGURE 9:
Cytokine mRNA expression from isolated small intestine enterocytes from Prkciflox/flox Vil-CRE± (KO). Each data set comprises mRNAs from two different groups of animals for control littermates (lm) and KO, except for CXCL-1, which also comprises animals treated with oral SS or intraperitoneal Y27628. For each group, values were normalized to one control animal (lm). Horizontal lines represent average. Vimentin and IL-1β mRNA were measured in preparations of isolated enterocytes (E) or spleen (S) from the same animals to assess connective tissue contamination of the epithelium preparations. Kruskal–Wallis test, H0 = control lm and KO populations are equal, p < 0.005 (CXCL-1), p < 0.05 (CXCL-2), p < 0.05 (IL-1α), SS or Y27628 groups, not significant. For vimentin and IL-1b, H0 = spleen data are equal to enterocytes, p < 0.001.

