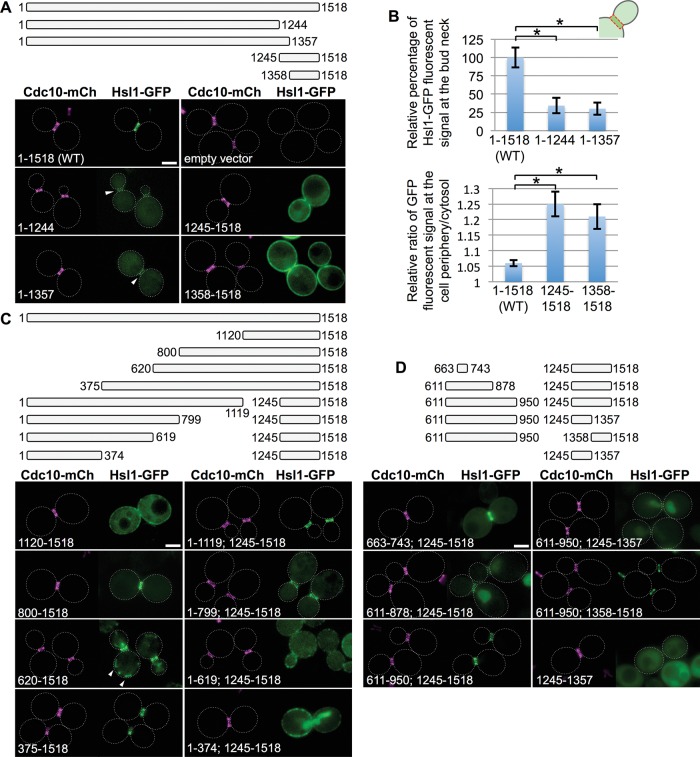
FIGURE 2:
Residues 611–950 of Hsl1 are necessary and sufficient, in conjunction with the C-terminal KA1 domain, for optimal bud neck localization. (A) Top, diagram of Hsl1 and the indicated C-terminal truncations and C-terminal fragments that were examined. Bottom, plasmids producing full-length Hsl1 (pGF-IVL521), empty vector (pRS315), or the indicated truncations and fragments (pGF-IVL522 through pGF-IVL525), expressed and visualized as in Figure 1, A and B. Arrowheads, GFP signal at the bud neck; dotted white line, cell periphery; scale bar, 2 μm. For clarity, only one or a few representative cells are shown for each construct. and the dotted white line is omitted for constructs that exhibited significant PM fluorescence. (B) Top, relative average pixel intensity of the GFP signal at the bud neck was quantified in triplicate using ImageJ. Error bars, SEM; asterisk, statistically significant difference (p < 0.05) using an unpaired t test. Bottom, relative PM fluorescence quantified as the ratio of the maximum pixel intensity of the PM signal vs. the average cytosolic fluorescence signal, measured as described in detail in Supplemental Figure S3. (C) Top, diagram of Hsl1 and the indicated N-terminal truncations and internal deletions that were examined. Bottom, plasmids producing the indicated truncations and deletions (pGF-IVL526 through pGF-IVL533), expressed and visualized as in Figure 1, A and B. Arrowheads, structures consistent with some mitochondrial localization; scale bar, 2 μm. (D) Top, diagram of the indicated internal fragments fused, where shown, to the indicated C-terminal fragments that were examined. Bottom, plasmids producing the indicated constructs (pGF-IVL534 through pGF-IVL536, left; pGF-IVL624 through pGF-IVL626, right), expressed and visualized as in Figure 1, A and B. Scale bar, 2 μm.

