FIGURE 1:

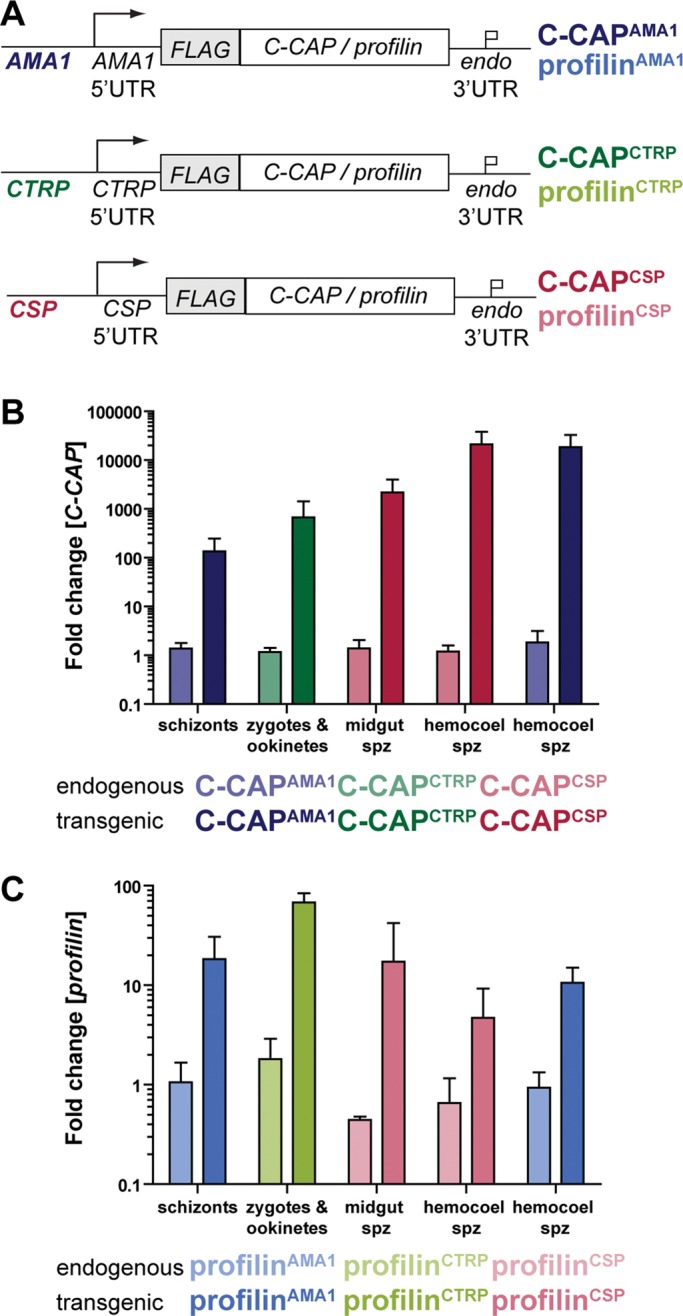
Stage-specific overexpression of C-CAP and profilin. (A) Schematic of the overexpression strategy to place C-CAP and profilin and their respective 3′ UTRs under the control of the AMA1, CTRP, or CSP promoter (indicated by superscripts). For detection, proteins contained an additional amino-terminal triple FLAG-tag. Parasite lines with the AMA1 promoter are indicated in blue (top), with the CTRP promoter in green (center), and with the CSP promoter in red (bottom). Transgenic parasites overexpressing C-CAP are shown in dark colors and those overexpressing profilin in light colors. (B, C) Expression profiling of (B) C-CAP and (C) profilin in different stages of transgenic parasite lines by qRT-PCR. Fold change of relative mRNA levels of endogenous (light color) and FLAG-tagged (dark color) C-CAP and profilin in transgenic lines were compared with the abundance of the endogenous transcripts in WT parasites from the same parasite stage. Relative mRNA levels were normalized to expression levels of HSP70/1 mRNA. The results represent mean values (± SD) of three independent experiments, except for profilinCTRP ookinetes and profilinCSP hemocoel sporozoites (n = 2).
