FIGURE 2:
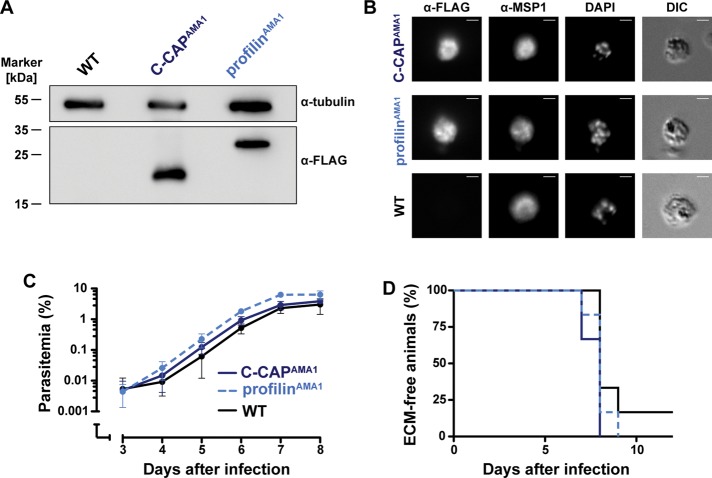
Normal growth and virulence of transgenic asexual blood-stage parasites. (A) Western blot analysis of FLAG-tagged proteins in schizonts. Samples were probed with an anti-FLAG antibody, with anti-tubulin antibodies used as control. (B) Immunofluorescence micrographs of schizonts stained with anti-FLAG (green), anti-MSP1 (red) antibodies, and 4′,6-diamidino-2-phenylindole (DAPI; blue). Bars, 2 μm. (C) Parasitemia development after intravenous injection of 1000 infected erythrocytes. Growth curves of asexual blood-stage parasites are similar in all transgenic parasite lines (n = 6). (D) Kaplan–Meier analysis of mice that exhibit signature symptoms of ECM. All infected animals developed ECM symptoms, except for one profilinAMA1-infected mouse. Analysis by Kruskal–Wallis and Mantel–Cox tests indicated that differences are nonsignificant.

