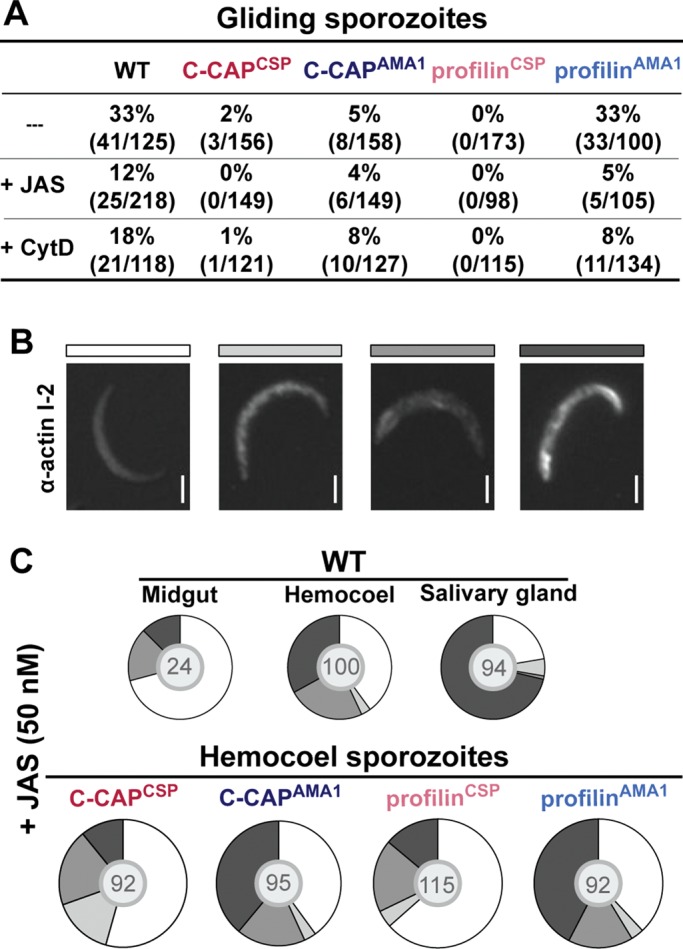
FIGURE 7:

Distinct localization of actin I in motile sporozoites. (A) Percentage of gliding hemocoel sporozoites in the presence of 50 nM JAS, 20 nM CytD, or solvent control. Motility was quantified from immunofluorescence micrographs and scored as gliders when a trail of full circle was observed. Numbers in brackets are gliders out of total sporozoites. No trails were observed in profilinCSP hemocoel sporozoites under all conditions tested. (B) Immunofluorescence micrographs of JAS-treated WT hemocoel sporozoites stained with an anti–P. berghei actin I-2 antibody. Four distinct patterns were recognized (labeled in four shades of gray on top of the images). Bars, 1 μm. (C) Quantification of actin I localization in WT midgut, hemocoel, and salivary gland sporozoites (top) and transgenic hemocoel sporozoites (bottom). All samples were treated with 50 nM JAS and quantified based on the four categories. Numbers in the gray circle are total sporozoites.
