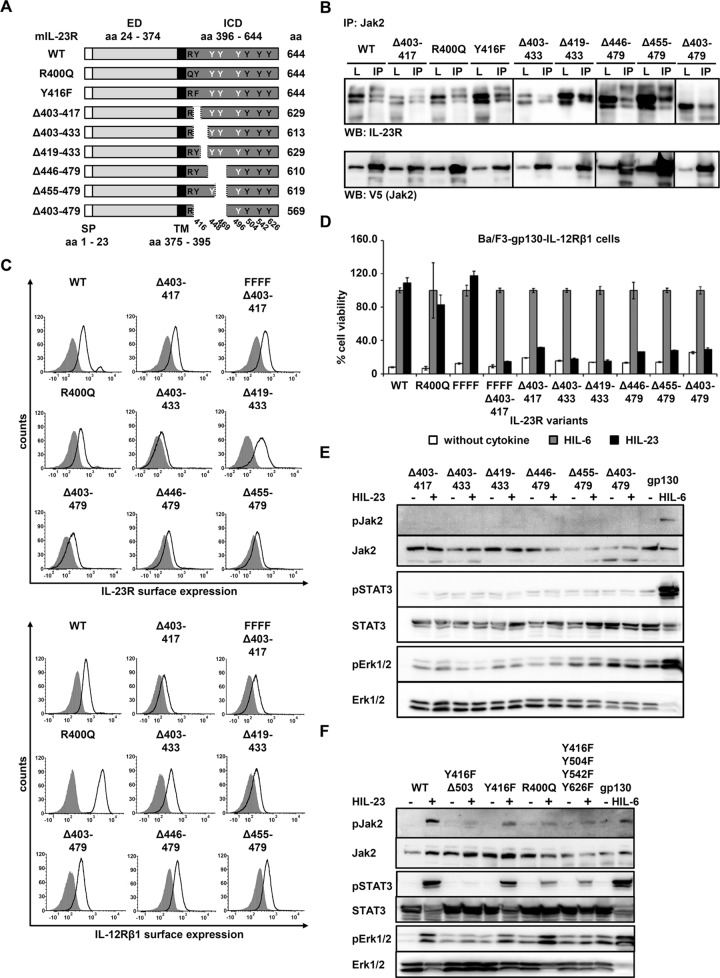
FIGURE 7:
Mutations and deletions of IL-23R ICD cannot disrupt Jak2 association. (A) Schematic representation of mIL-23R variants with mutations and deletions within the cytoplasmic domain (CD). Two mutation (R400Q and Y416F) and six deletion variants were generated. The extracellular (ED) and transmembrane (TM) domains of IL-23R are unaffected. Tyrosines within the CD are highlighted in black (Y416, Y504, Y542, and Y626, involved in IL-23 signaling) and white (Y448, Y469, and Y496). Y416F and R400Q are indicated. (B) COS-7 cells were cotransfected with cDNAs coding for murine Jak2 (V5 tagged) and full-length IL‑23R or a deletion/mutant variant. Jak2 was immunoprecipitated, and Western blot analysis was performed to detect the appropriate IL‑23R variant and Jak2. Three independent experiments were performed, and one representative experiment is shown. IP, Jak2 coimmunoprecipitation; L, lysate. (C) Representative histograms of IL‑23R (top) and IL‑12Rβ1 (bottom) surface expression of transduced Ba/F3-gp130 cell lines. Gray-shaded areas indicate Ba/F3-gp130 cells (negative control), and dark solid lines are the respective Ba/F3 cell lines as indicated. (D) Proliferation of stably transduced Ba/F3-gp130-mIL-12Rβ1 cells with cDNAs coding for murine IL‑23R (WT) or appropriate variants. Equal numbers of cells were cultured for 3 d in the presence of 0.2% HIL‑6–conditioned cell culture supernatant or 0.2% HIL‑23 or without cytokine. Proliferation was measured using the colorimetric CellTiter-Blue Cell Viability Assay. HIL‑6–dependent proliferation was set to 100%. Error bars represent SD for technical replicates. (E, F) Stably transduced Ba/F3 cells were washed three times, starved, and stimulated with HIL‑23. Cellular lysates were prepared, and 50 μg total protein per lane was loaded on SDS gels, followed by immunoblotting using specific antibodies for phospho-Jak2, Jak2, phospho-STAT3, STAT3, phospho-Erk1/2, and Erk1/2. Western blot data show one representative experiment out of three.

