FIGURE 2:

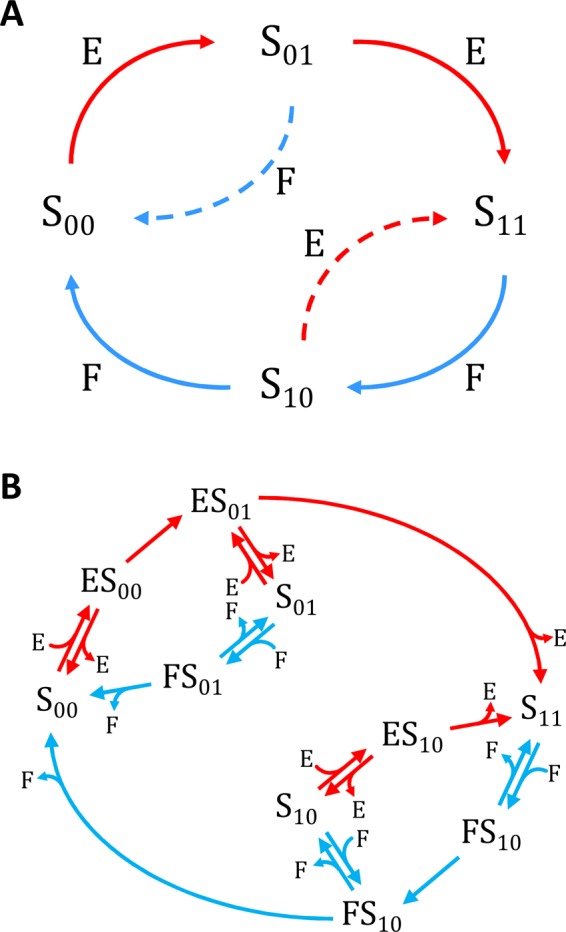
Reaction network (A) and reaction mechanism (B) in the minimal model of ERK regulation by MEK and MKP3. Table 1 gives rate constants associated with each reaction step in B.

Reaction network (A) and reaction mechanism (B) in the minimal model of ERK regulation by MEK and MKP3. Table 1 gives rate constants associated with each reaction step in B.