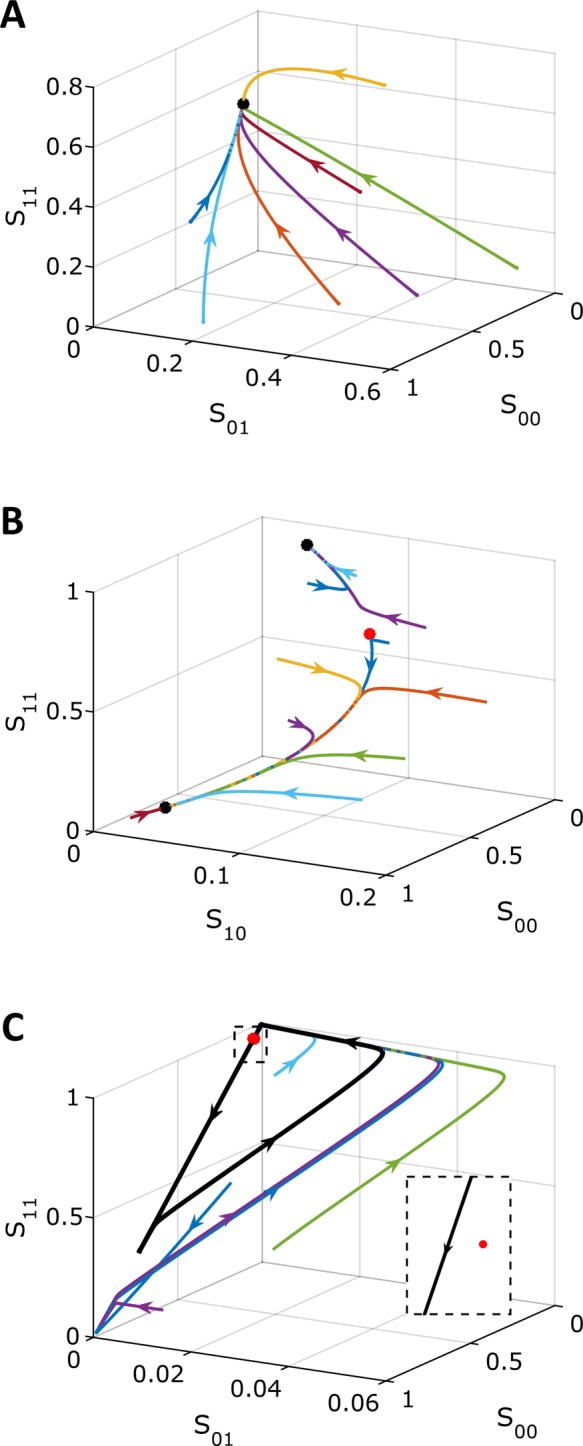
FIGURE 3:

Three types of long-term dynamics in the model: a unique stable steady state (A), bistability (B), and a stable limit cycle (C). Colors are trajectories in phase space from multiple initial conditions. Black dots correspond to stable steady states and red dots to unstable steady states. The black trajectory in C corresponds to the stable limit cycle, which all initial conditions approach after long times. The inset in C zooms in near the unstable steady state, showing that the limit cycle orbit passes very close by the unstable steady state. Phase plots were constructed by numerically integrating the full model. Table 2 gives the parameter values.
