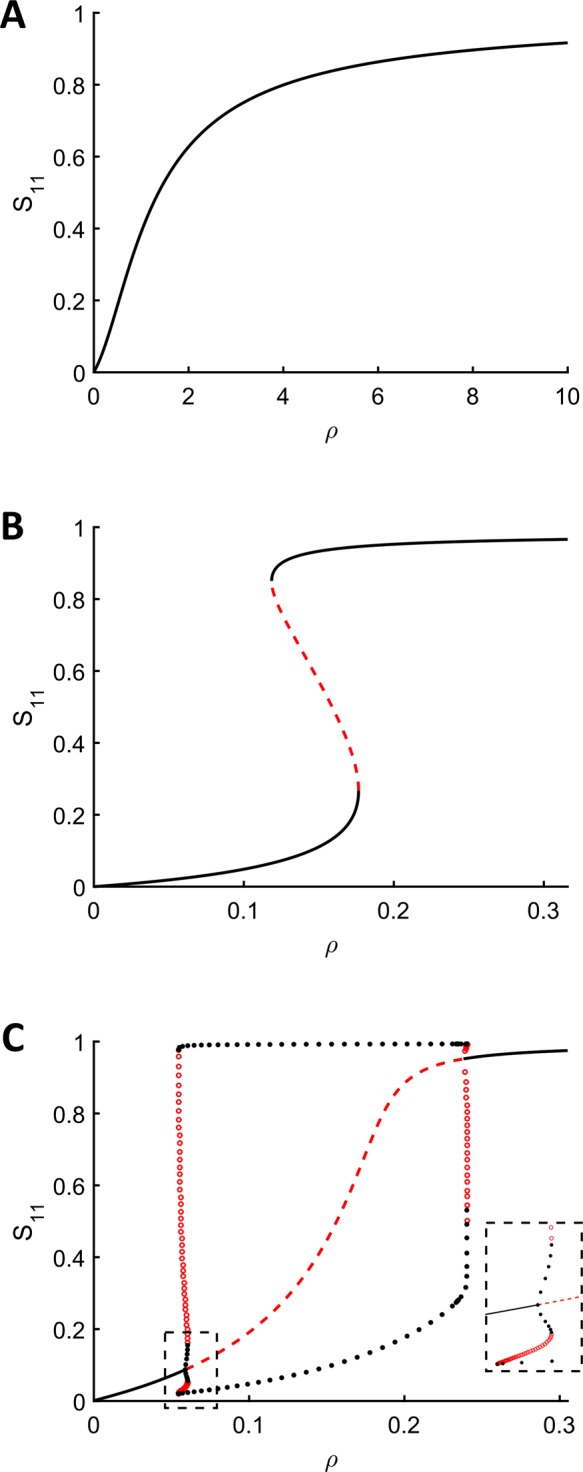
FIGURE 4:

Branches of steady states as a function of the ratio of the total amounts of kinase and phosphatase,  . All parameters other than the total kinase concentration are the same as those in Table 2. (A) The system only has a unique stable steady state for all values of ρ. (B) The system has two stable steady states for some values of ρ and exhibits switch-like behavior and hysteresis. (C) The system exhibits limit cycles for a range of values of ρ. Close to the left bifurcation point, two stable limit cycles can coexist, separated by unstable limit cycles. The Supplemental Materials contain Matlab code for numerically integrating the equations at the parameters and total enzyme concentrations for which two stable limit cycles coexist. The inset zooms in on the region near the left bifurcation point. Note that in all three cases shown here, numerical continuation was performed on the full model of the dual phosphorylation cycle, showing that the nonlinear behaviors found under the pseudo–steady state approximation lift back to the full model in most cases. In addition, Etot and Ftot are both <<Stot for all values of ρ in these bifurcation diagrams.
