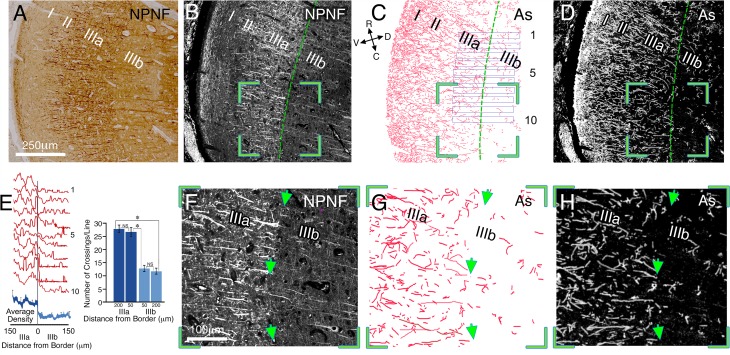
Figure 4. Relationship between interlaminar astrocyte processes and the sublaminar border of layers IIIa/IIIb in the post-mortem human striate cortex.
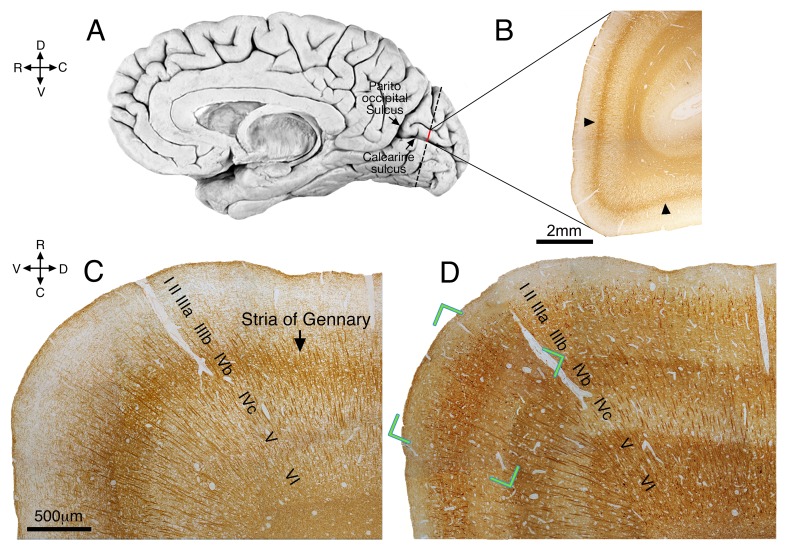
Immunohistochemical staining of coronal sections of human area V1, illustrating the relationship between interlaminar astrocyte processes and the sublaminar border of layers IIIa/IIIb. (A) Bright field photograph of coronal section through V1 stained for NPNF (non-phosphorylated neurofilament), a higher magnification, image of the area is shown in Figure 4—figure supplement 1D. The border between IIIa/IIIb is demarcated by the heavily (II & IIIa) and lightly (IIIb) stained bands. (B and D) Immunofluorescent double staining for NPNF (B) and GFAP (D), respectively, on a section adjacent to that of A. The border between IIIa/IIIb is demarcated by a green line. (C) A manual reconstruction of the astrocyte processes (As) in image D. (E) Left panel: superimposed density plot measurements of ten 30 µm wide bands perpendicular to the border (plotted in C) in layers IIIa/IIIb (individual traces-red, average-blue). Right panel: a graphic representation of the number of astrocyte processes crossing a matrix of lines (375 µm length), which were drawn at layers IIIa and IIIb, 50 and 200 µm from the IIIa/IIIb border aligned with the border's orientation (not shown). (F–H) Enlarged image of stained pyramidal cell bodies and apical dendrites, as well as astrocyte processes taken from the green bounded region in B–D, respectively, showing further details of the astrocyte processes. Arrow heads point to a clearly visible IIIa/IIIb border


