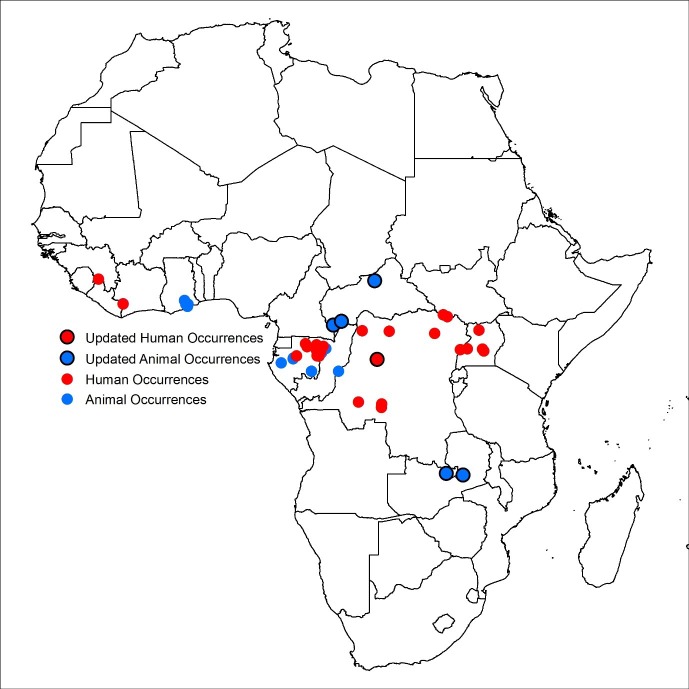
Figure 1. Updated Ebola virus disease occurrence database.
Human index cases are represented by red circles, animal occurrences in blue. New occurrence information is indicated by the black circle. The coordinates of polygon centroids are displayed for occurrences defined by an area greater than 5 km x 5 km.

