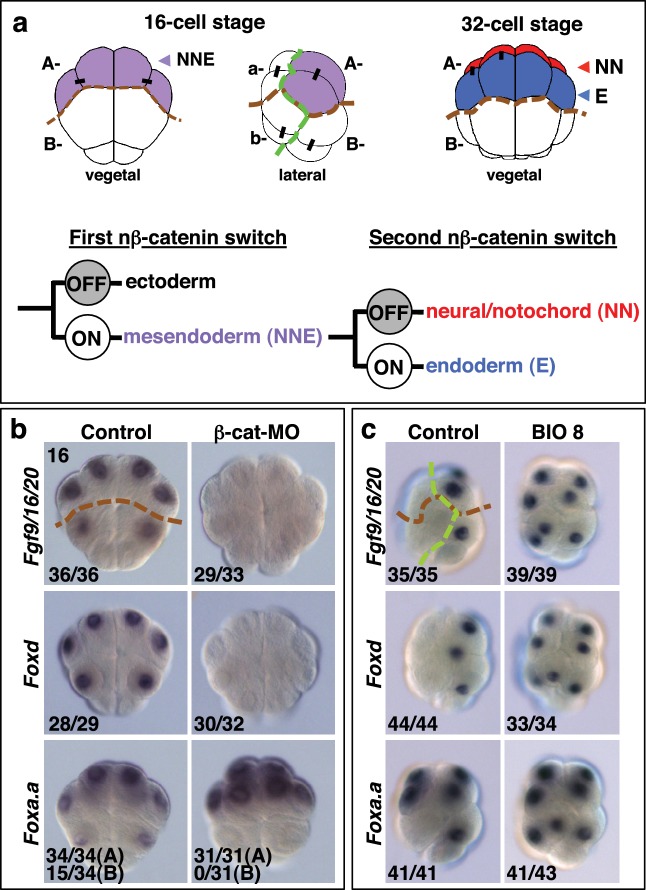
Figure 1. Foxa.a, Foxd and Fgf9/16/20 are candidate NNE lineage specification factors.
(a) Schematic drawings of embryos at the 16- and 32-cell stages. In this and all subsequent figures, where shown, a green dashed line separates the animal (ectoderm) from the vegetal (mesendoderm) hemispheres and a brown dashed line separates A- (A4.1) and a- (a4.2) lineages from B- (B4.1) and b- (b4.2) lineages. Different embryonic founder lineages are indicated on the drawings. NN and E cells are indicated in red and blue, respectively. Below the embryo drawings is a schematic representation of the two rounds of nβ-catenin-driven binary fate decisions that segregate firstly the mesendoderm lineages from the ectoderm lineages at the 16-cell stage and secondly segregate the mesoderm (NN) lineages from the endoderm (E) lineages at the 32-cell stage (Hudson et al., 2013). (b, c) Embryos analysed at the 16-cell stage for the marker indicated to the left of the panels following the treatment indicated above the panels [(b) vegetal pole view; (c) lateral view, vegetal pole to the right]. The numbers on the bottom-left corner of each panel indicate the proportion of embryos that the panel represents. The posterior most cells (at the bottom of the panels) are transcriptionally quiescent cells that will generate the germ line (Shirae-Kurabayashi et al., 2011). For Foxa.a expression in (b) control embryos showed expression in all four A-line (NNE) cells in 34/34 embryos, and in B-line cells, in 15/34 embryos, as indicated, whereas β-catenin-MO (β-cat-MO) injected embryos showed expression in NNE cells (31/31), but not B-line (0/31). Expression of Foxa.a in the four a-line precursors (not visible in the image) was not affected by β-catenin-MO injection.

