. 2016 Jun 28;5:e14692. doi: 10.7554/eLife.14692

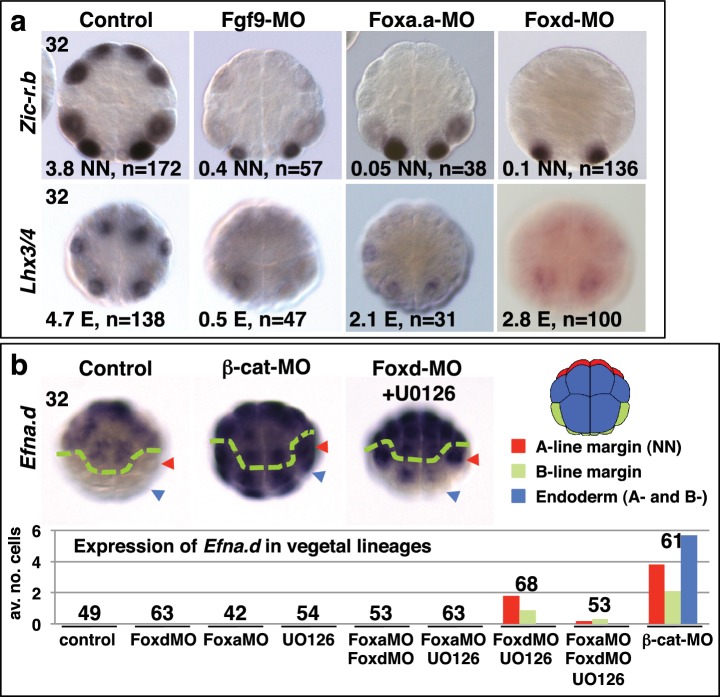
Figure 2. Foxa.a, Foxd and Fgf9/16/20 are required for initiation of NN and E gene expression.

(a) Embryos analysed at the 32-cell stage. The marker analysed is indicated on the left of the panels and the treatment indicated above the panels. The average number of NN (Zic-r.b) or E (Lhx3/4) cells expressing detectable levels of each gene is indicated. This remaining expression was generally weaker than control level expression. ‘n=’ represents the number of embryos analysed. (b) Expression of Efna.d under the conditions indicated. Embryos are shown in notochord-side view, animal pole up. The graph shows the average number of cells expressing Efna.d in different vegetal lineages at the 32-cell stage, as indicated by the key. All embryos showed ectoderm expression. The number of embryos analysed is indicated above the bars on the graph.

DOI: http://dx.doi.org/10.7554/eLife.14692.003

Figure 2.

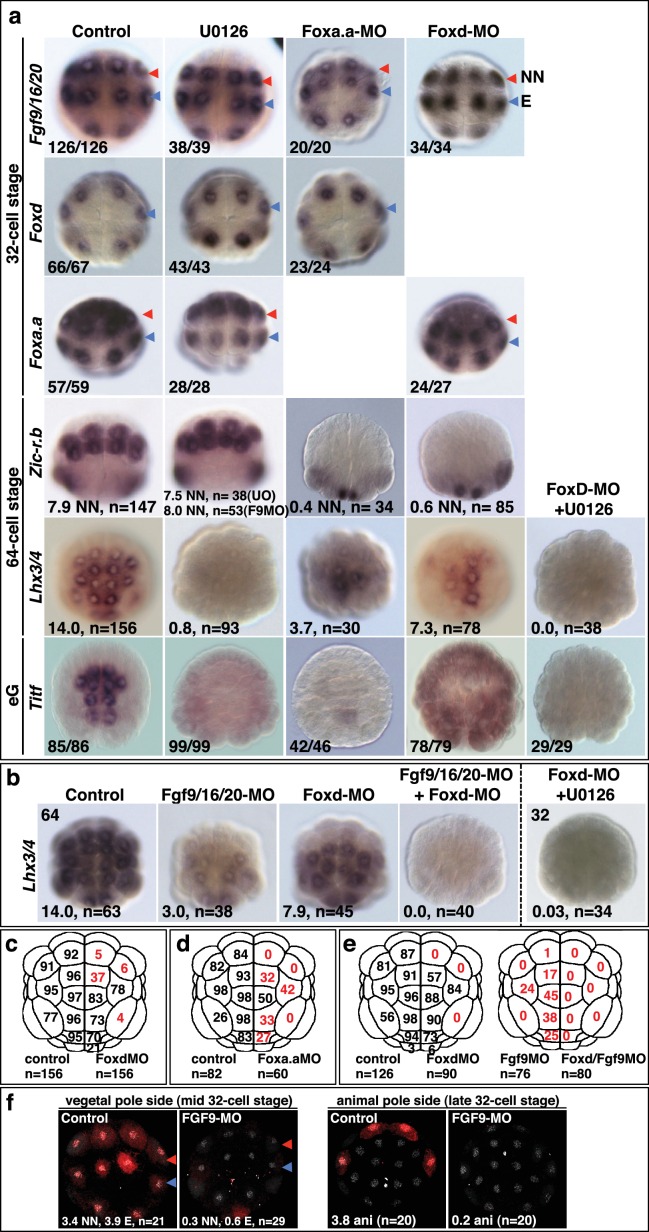
Figure 2—figure supplement 1. Foxa.a, Foxd and Fgf9/16/20 are required for initiation of NN and E gene expression.

Figure 2—figure supplement 1.

(a–b) Embryos analysed at the 32-cell, 64-cell or early gastrula stage (eG), as indicated, for the marker indicated to the left of the panels and following the treatment indicated above the panels. Embryos in vegetal pole view. For the top three rows of panels, the proportion of embryos that the panel represents is shown. For Foxd expression, embryos were counted if at least five E cells show expression, regardless of level; for Fgf9/16/20 and Foxa.a, embryos were scored positive if at least three NN and three A-line E cells showed expression, regardless of level. Expression in other domains of the embryo were also not affected by these treatments, except for Foxd expression in NN cells which appeared slightly increased in U0126-treated embryos (control embryos displayed an average of 0.2 cells strong and 0.6 cells weak expression in NN cells, UO126-treated embryos displayed an average of 0.9 cells strong and 0.9 cells weak expression). 64-cell stage expression of Zic-r.b is presented as the average number of NN lineage cells with expression. The result for Fgf9-MO is included in the U0126 panel. Lhx3/4 is presented as the average number of cells expressing per embryo. For Titf, the numbers indicate the proportion of embryos that the panel represents. (c–e) The percentage of embryo halves showing detectable (strong and weak) Lhx3/4 expression in each vegetal lineage following the treatments indicated. n = the number of embryos halves scored. A 50% reduction in expression compared to controls is indicated in red. Note the preferential loss of marginal (notochord and mesenchyme lineage) expression compared to endoderm lineage expression following Fox gene inhibition. (f) ERK1/2 activation at the 32-cell stage depends on Fgf9/16/20. Anti-dpERK immunofluorescence was carried out on mid-32-cell stage embryos for vegetal dpERK detection and late 32-cell stage embryos for the animal cells. The average number of NN, E and animal cells per embryo exhibiting dpERK activity are shown. NN cells generally exhibited weaker ERK activity compared to E cells. ‘n=’ indicates the total number of embryos analysed.
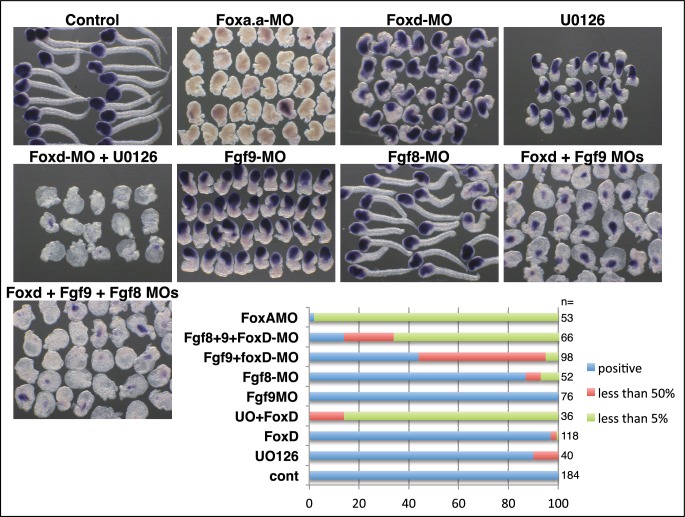
Figure 2—figure supplement 2. Endoderm formation under various conditions.

Figure 2—figure supplement 2.

Detection of alkaline phosphatase activity under the conditions indicated above the panels. Fgf9=Fgf9/16/20; Fgf8=Fgf8/17/18. Endoderm is lost with Foxa.a-MO or a combination of Foxd-MO/U0126. Small amounts of endoderm remain in Foxd-MO/Fgf9-MO embryos. We have previously shown that Fgf8/17/18, expressed from the 64-cell stage, cooperates with Fgf9/16/20 during notochord induction (Yasuo and Hudson, 2007). Co-inhibition of Fgf9/16/20, Fgf8/17/18 and Foxd led to a stronger down regulation of alkaline phosphatase, suggesting that Fgf8/17/18 cooperates with Fgf9/16/20 during endoderm induction. The graphs shows the proportion of embryos (%) with strong and reduced (compared to control) alkaline phosphatase activity, as indicated on the key, following the treatments indicated on the left. ‘n=’ indicates the number of embryos analysed.